Fig. 1
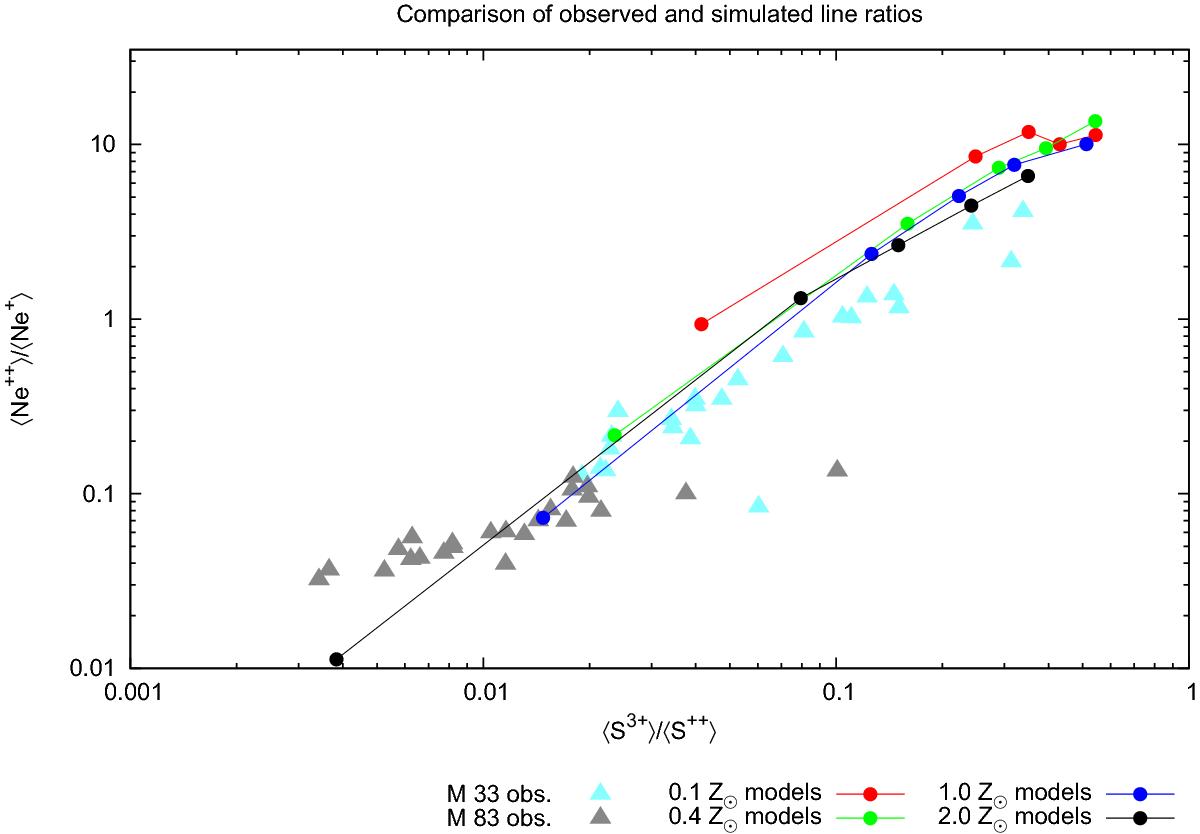
Comparison of observed ionic number ratios ⟨ S3 + ⟩ / ⟨ S2 + ⟩ and ⟨ Ne2 + ⟩ / ⟨ Ne+ ⟩ to the corresponding results from our model H ii regions. The triangles represent H ii regions in the metal rich galaxy M 83 (gray, values from Rubin et al. 2007) and M 33 (cyan triangles, values from Rubin et al. 2008); the circles represent model H ii regions using as ionizing sources dwarf stars with temperatures from 35 000 K to 55 000 K and metallicities of 0.1 Z⊙ to 2.0 Z⊙. The lower metallicities are correlated with a larger fraction of the higher ionization stages both in the observations and the synthetic H ii region models.
Current usage metrics show cumulative count of Article Views (full-text article views including HTML views, PDF and ePub downloads, according to the available data) and Abstracts Views on Vision4Press platform.
Data correspond to usage on the plateform after 2015. The current usage metrics is available 48-96 hours after online publication and is updated daily on week days.
Initial download of the metrics may take a while.