Fig. 6
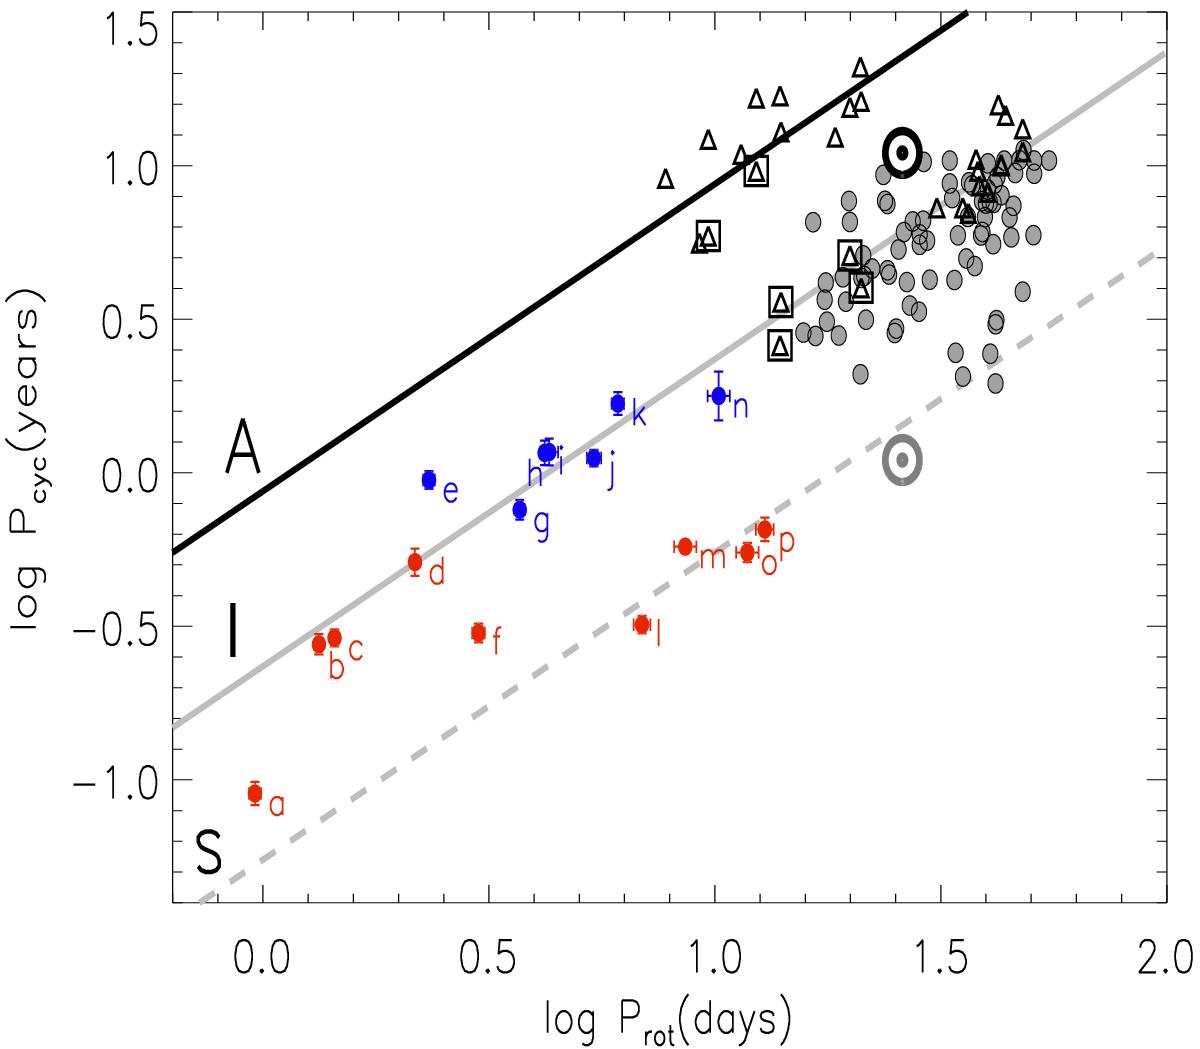
Pcyc (in years) as a function of the Prot (in days) on logarithmic scales, with our data represented by red (Q> 0.75) and blue (Q< 0.75) circles, data from Saar & Brandenburg (1999) by black triangles, and data from Lovis et al. (2011) by gray circles. The squares indicate the sources with secondary periods for some stars on the A sequence according to Saar & Brandenburg (1999). The Sun’s magnetic cycle periods of 11.6 yr (black Sun symbol) and 1.1 yr (gray Sun symbol) are also represented. The Pcyc versus Prot empirical relations (full lines A and I sequences) proposed by Böhm-Vitense (2007) are also displayed. The empirical relations for shorter term stellar magnetic cycle periods (dashed line S sequence) were obtained by shifting the I sequences by a factor of 1/4.
Current usage metrics show cumulative count of Article Views (full-text article views including HTML views, PDF and ePub downloads, according to the available data) and Abstracts Views on Vision4Press platform.
Data correspond to usage on the plateform after 2015. The current usage metrics is available 48-96 hours after online publication and is updated daily on week days.
Initial download of the metrics may take a while.