Free Access
Fig. 2
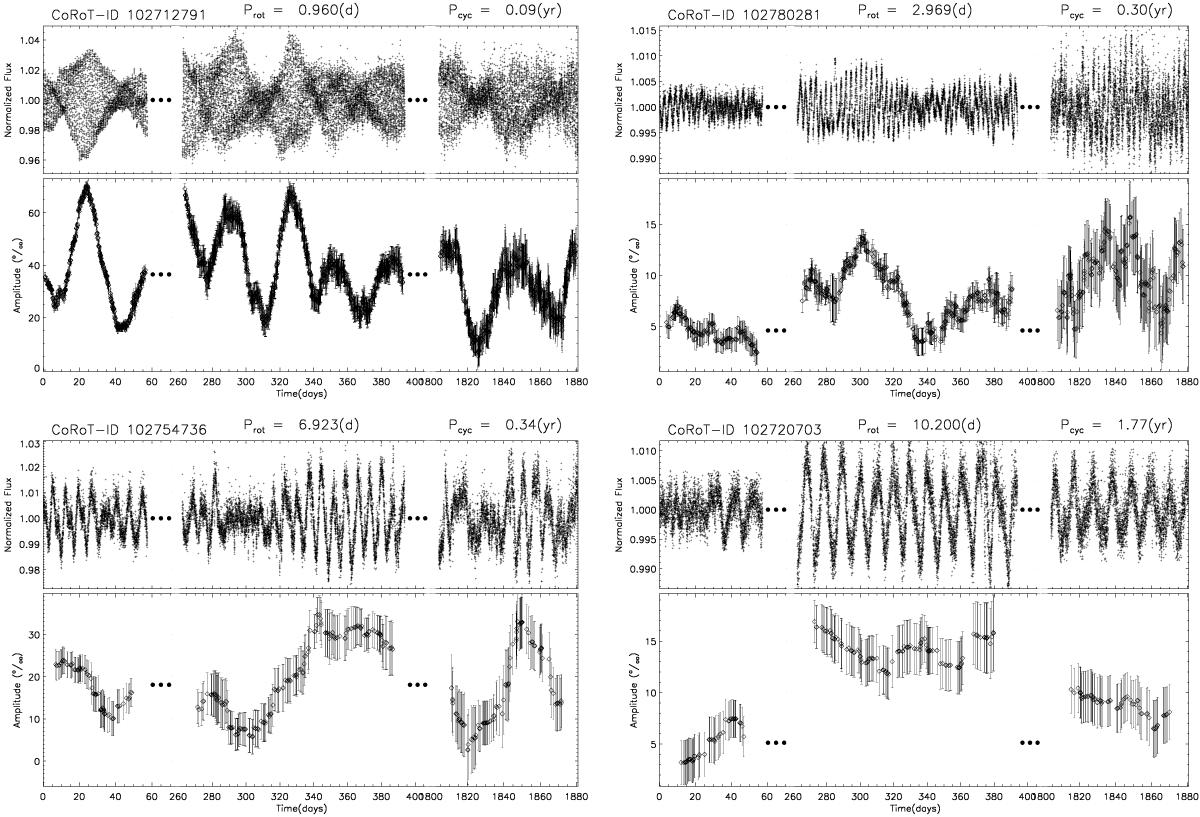
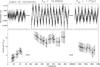
CoRoT LCs and the A(t) time series for typical sources in our final sample. For each star we show the combined LC (upper panel), with the corresponding A(t) time series (bottom panel). The ID and computed Pcyc and Prot are given above each panel.
This figure is made of several images, please see below:
Current usage metrics show cumulative count of Article Views (full-text article views including HTML views, PDF and ePub downloads, according to the available data) and Abstracts Views on Vision4Press platform.
Data correspond to usage on the plateform after 2015. The current usage metrics is available 48-96 hours after online publication and is updated daily on week days.
Initial download of the metrics may take a while.