Fig. 1
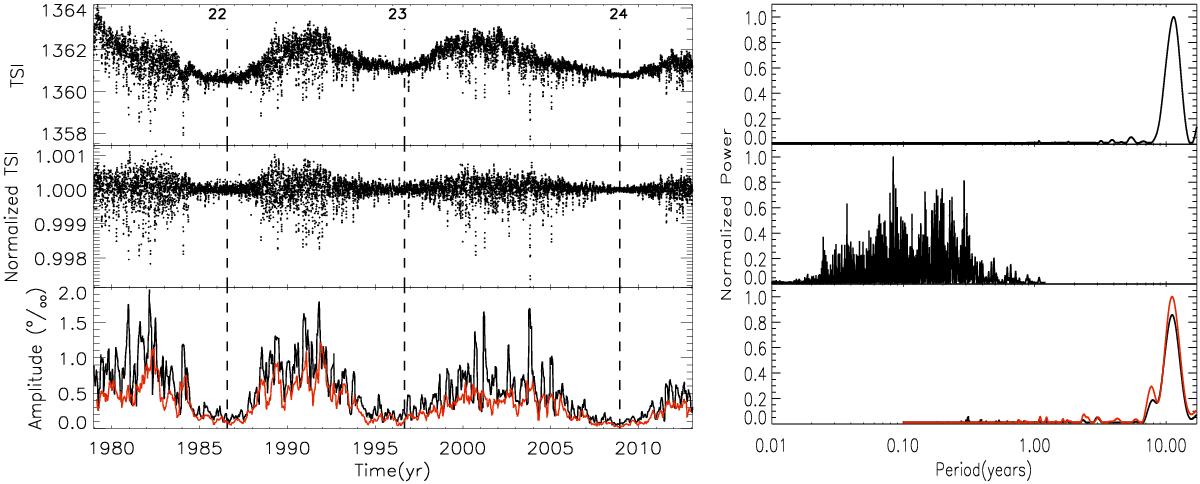
Total solar irradiance LC (top-left panel), the prewhitened TSI LC (middle-left panel), the amplitude variation A(t) obtained from the prewhitened TSI LC (bottom-left panel), and Lomb-Scargle periodograms corresponding to each LC (right panels). In the left panels, the dashed vertical lines mark the beginning of each solar cycle, based on review from Hathaway (2010). In the bottom left panel, the A(t) time series is depicted for Nbox = 2 (black solid curve) and Nbox = 5 (red solid curve), whereas in the bottom right panel the Lomb-Scargle periodogram of A(t) is shown for each Nbox value with their respective colors.
Current usage metrics show cumulative count of Article Views (full-text article views including HTML views, PDF and ePub downloads, according to the available data) and Abstracts Views on Vision4Press platform.
Data correspond to usage on the plateform after 2015. The current usage metrics is available 48-96 hours after online publication and is updated daily on week days.
Initial download of the metrics may take a while.