Fig. 6
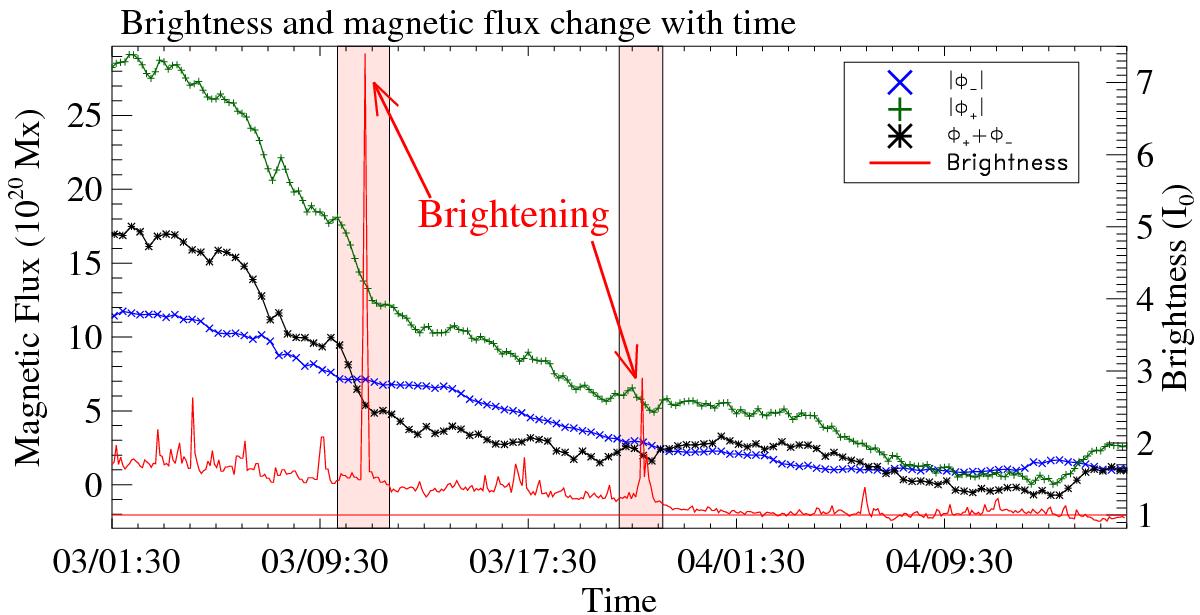
Temporal evolution of magnetic flux and brightness in the EUV 304 Å channel (see the red curve) in the white rectangles of Figs. 5d and l from 01:30 UT on 3 April 2013 to 16:18 UT on 4 April 2013. The black profile indicates the evolution of total magnetic flux, while the blue and green profiles denote the unsigned negative and positive magnetic flux. Two times of intense EUV eruptions are denoted by two arrows in the two vertical rectangles.
Current usage metrics show cumulative count of Article Views (full-text article views including HTML views, PDF and ePub downloads, according to the available data) and Abstracts Views on Vision4Press platform.
Data correspond to usage on the plateform after 2015. The current usage metrics is available 48-96 hours after online publication and is updated daily on week days.
Initial download of the metrics may take a while.