Fig. 3
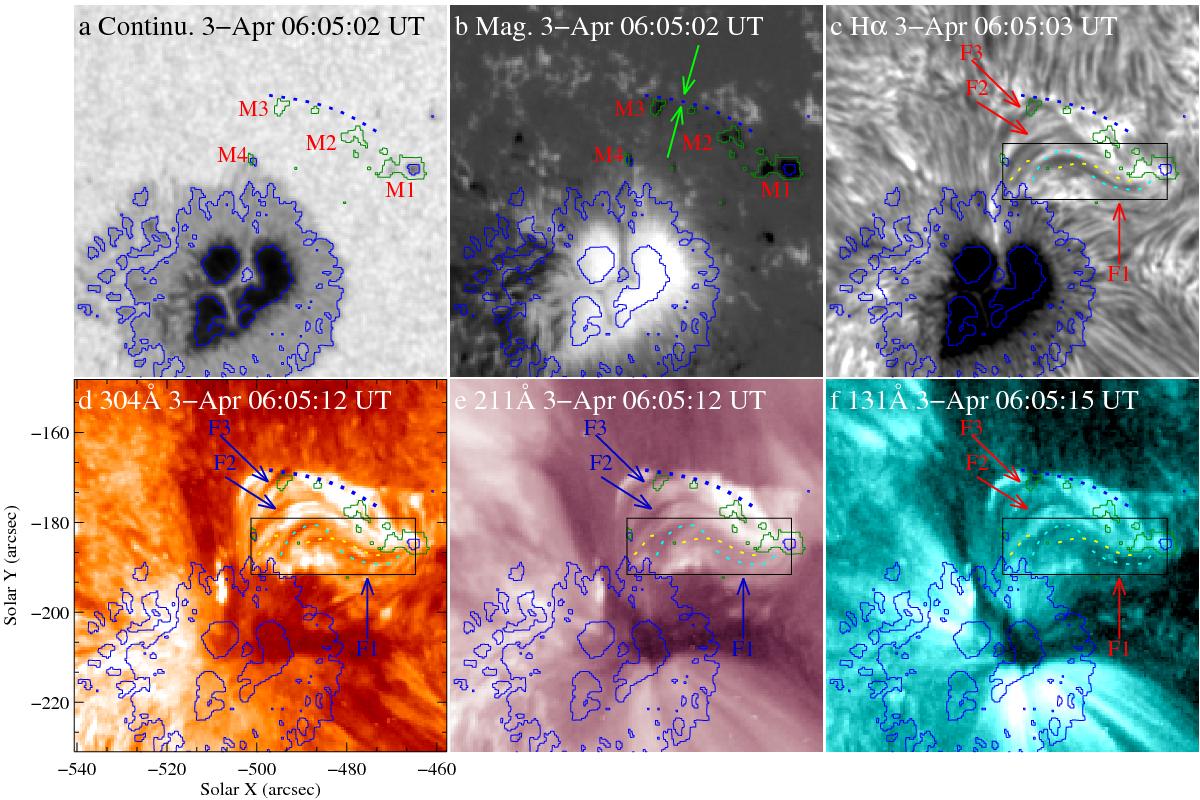
MMFs and the related AFSs in multiwavelength observations at 06:05 UT on 3 April 2013. Panel a): continuum-intensity image showing the positions of the MMFs (M1, M2, M3, and M4) relative to the sunspot. Panel b): MMFs in the magnetogram image. Panels c)−f): the related filaments (F1, F2, F3) in the observations of Hα (panel c)), EUV 304 (panel d)), 211 (panel e)), and 131 (panel f)) Å. The fibrils in F1 showed some twisting (see dotted curves in the black boxes). The blue and green contours denote the continuum intensity and magnetic flux density with the values of [0.3, 0.8] I1 and [–110] G, respectively. An animation of the HMI continuum intensity, HMI magnetograms, Hα, 304 Å, 211 Å, and 131 Å channels shown in this figure is available in the online edition.
Current usage metrics show cumulative count of Article Views (full-text article views including HTML views, PDF and ePub downloads, according to the available data) and Abstracts Views on Vision4Press platform.
Data correspond to usage on the plateform after 2015. The current usage metrics is available 48-96 hours after online publication and is updated daily on week days.
Initial download of the metrics may take a while.