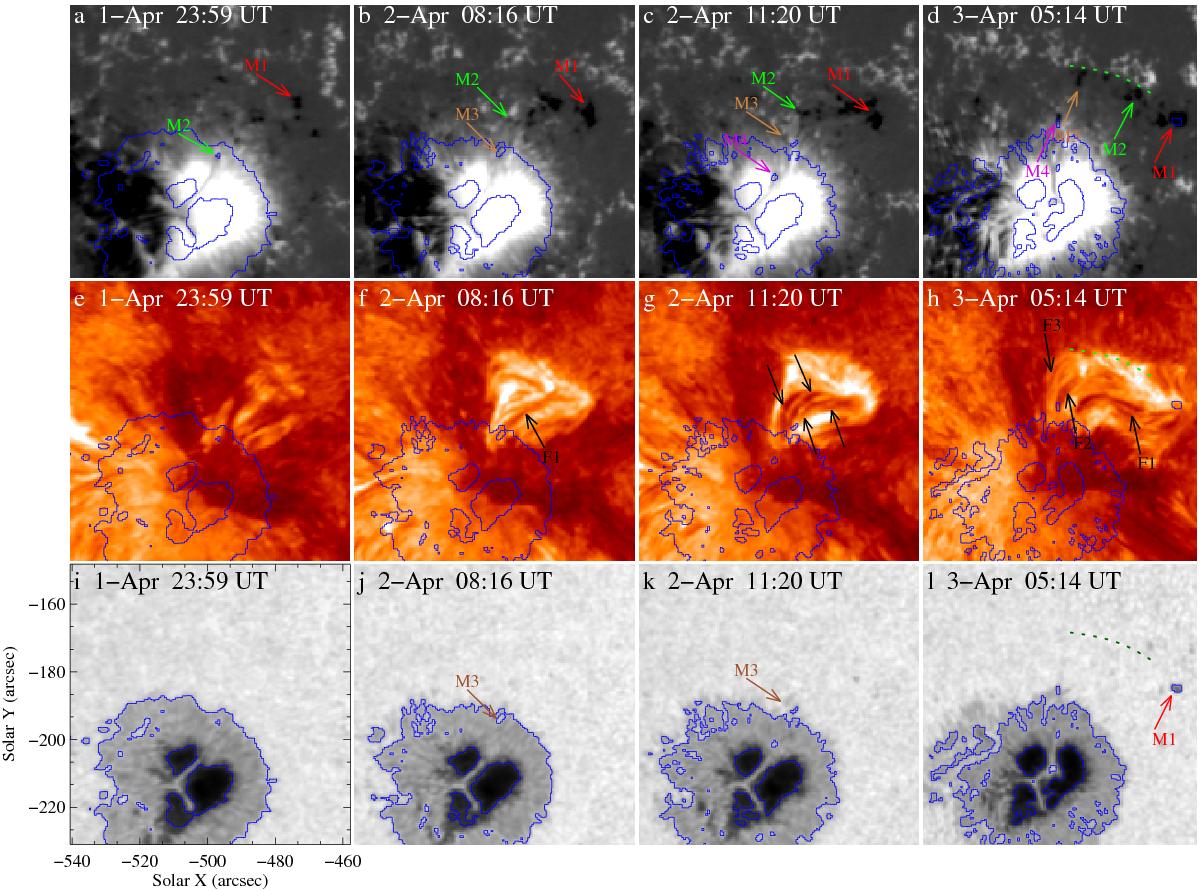
Fig. 2
MMFs and their related AFSs. Panels a)–d): HMI magnetograms showing the MMFs of negative polarity (M1, M2, M3, and M4 denoted by red, green, brown, and purple arrows) emerging from the penumbra of the sunspot. Panels e)–h): the MMFs related arch filaments (F1, F2, F3) in EUV 304 Å images. Panels i)–l) are the corresponding continuum intensity images at each moment. MMFs are observed to frequently cancel with their surrounding positive flux in the place as denoted by dotted lines in panels d), h), and l). Continuum intensity are contoured in each panel at the simultaneous moment with the value of [0.3, 0.8] I1. An animation of the HMI magnetograms, 304 Å and HMI continuum intensity channels shown in this figure is available in the online edition.
Current usage metrics show cumulative count of Article Views (full-text article views including HTML views, PDF and ePub downloads, according to the available data) and Abstracts Views on Vision4Press platform.
Data correspond to usage on the plateform after 2015. The current usage metrics is available 48-96 hours after online publication and is updated daily on week days.
Initial download of the metrics may take a while.