Fig. 1
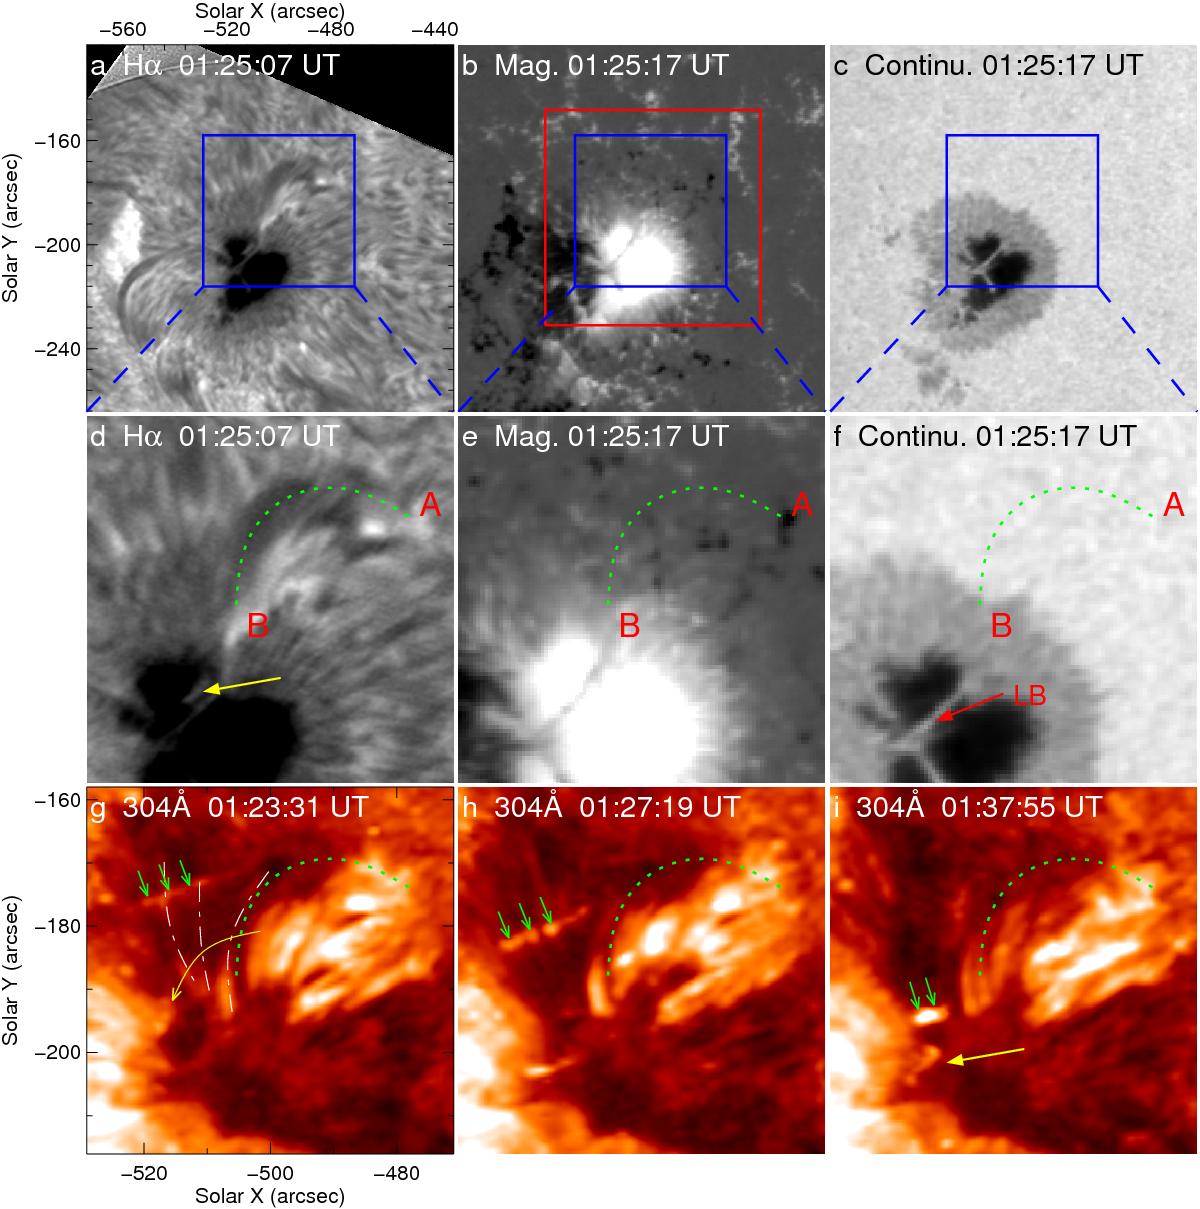
Co-aligned images of the multiwavelength observations. Panels a)–f): the aligned Hα, magnetogram, and continuum intensity images. Middle panels are the corresponding subsets of the top panels in the blue FOV. Panels g)–i): in 304 Å images, bright mass motion (green arrows) swept the periphery (denoted by white dashed-dotted lines in panel g)) of the arch filament from the north to the south and even reached the very close vicinity of the LB (the yellow arrow in panel i)) in the blue FOV. A red box in panel b) denotes the FOV of subsequent Figs. 2−5. Green dotted lines “A–B” indicate the long axis of the arch filament. The red arrow in panel f) denotes the LB discussed in this work. An animation of the Hα, 304 Å, and HMI continuum intensity channels shown in this figure is available in the online edition.
Current usage metrics show cumulative count of Article Views (full-text article views including HTML views, PDF and ePub downloads, according to the available data) and Abstracts Views on Vision4Press platform.
Data correspond to usage on the plateform after 2015. The current usage metrics is available 48-96 hours after online publication and is updated daily on week days.
Initial download of the metrics may take a while.