Fig. 6
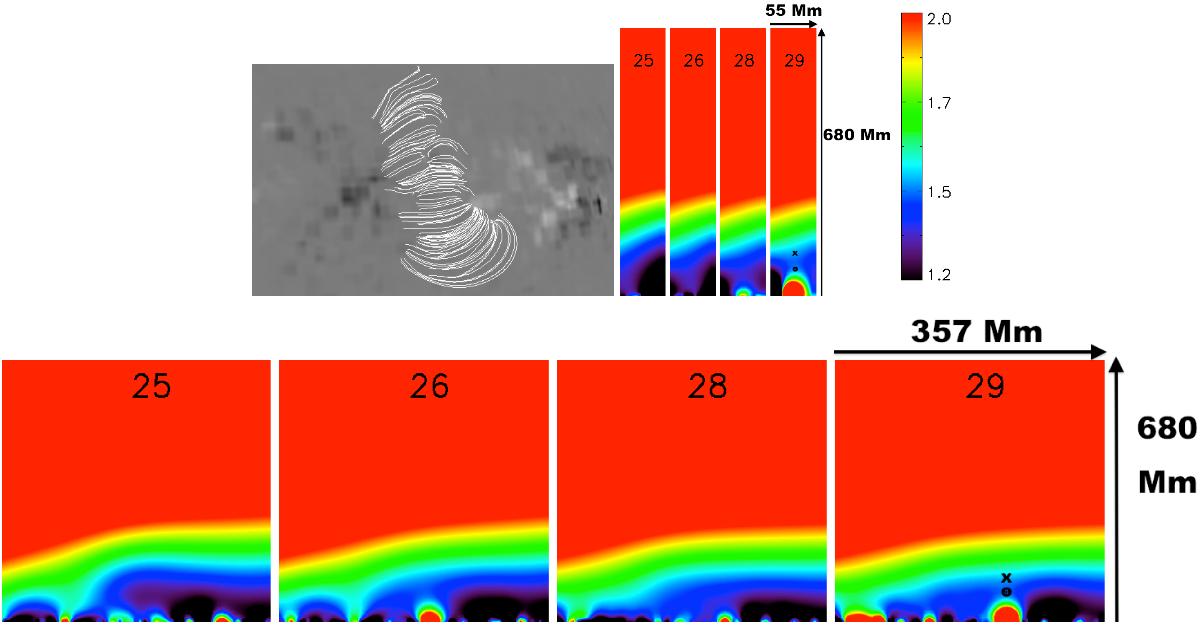
Top left: PFSS magnetic rendering corresponding to the filament region rendered by PFSS for Sept. 29 data. A low-resolution magnetogram was used, with the same FOV as Fig. 1 (right). Top right: transverse slice of the decay index n across the volume that encloses the filament and emergence. The estimated height of the filament for Sept. 29 is marked with a black cross (corrected), or small circumference (uncorrected). Bottom: longitudinal slice of the decay index n along the volume that encloses the filament and emergence, and same symbols for the filament height. This figure belongs to Sect. 2.3.
Current usage metrics show cumulative count of Article Views (full-text article views including HTML views, PDF and ePub downloads, according to the available data) and Abstracts Views on Vision4Press platform.
Data correspond to usage on the plateform after 2015. The current usage metrics is available 48-96 hours after online publication and is updated daily on week days.
Initial download of the metrics may take a while.