Fig. 5
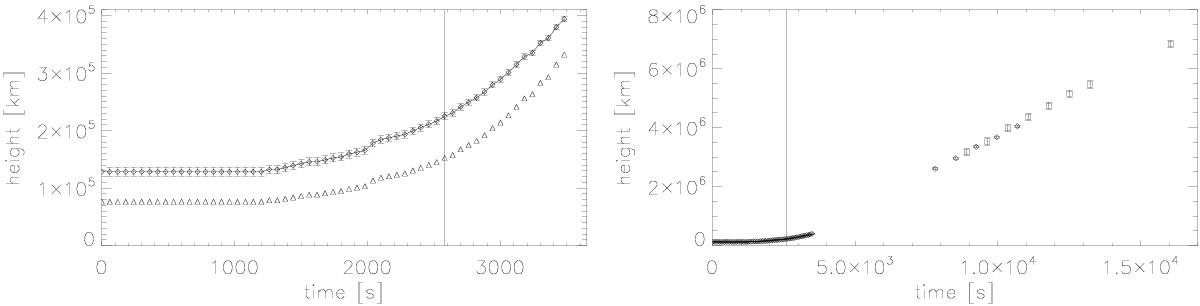
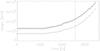
Left: height versus time of the filament apex. Two plots are shown: triangles represent the uncorrected height data; and the solid line indicates the height after correcting of heliocentric angle projection. Error bars are computed considering the visual error on height and angle correction. Time starts from 21:00 UT and covers 1 h. In the last 38 min, the height starts increasing. A vertical bar marks the flare onset, at 21:43 UT. Right: height-time diagram, including LASCO C2 (diamonds) and C3 (asterisks) data.
Current usage metrics show cumulative count of Article Views (full-text article views including HTML views, PDF and ePub downloads, according to the available data) and Abstracts Views on Vision4Press platform.
Data correspond to usage on the plateform after 2015. The current usage metrics is available 48-96 hours after online publication and is updated daily on week days.
Initial download of the metrics may take a while.