Free Access
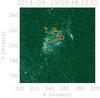
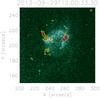
Fig. 4
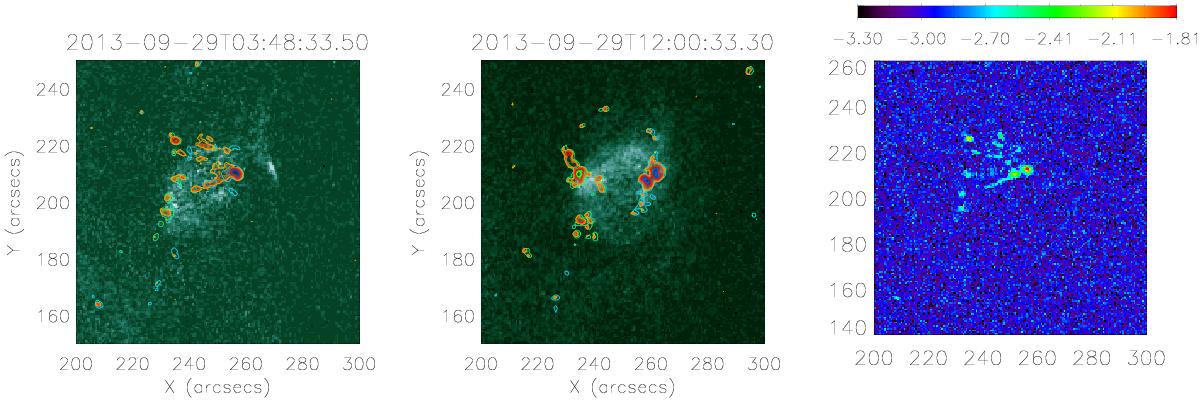
Left and centre: AIA 94 Å image at different instants with LOS-magnetic field superimposed, with the same contours as Fig. 2. Orange and red contours mark levels of 180, 200, 250, 400, 500 G in transverse field. Right: linear polarization map at 03:48 UT, plot in logarithmic colour scale.
This figure is made of several images, please see below:
Current usage metrics show cumulative count of Article Views (full-text article views including HTML views, PDF and ePub downloads, according to the available data) and Abstracts Views on Vision4Press platform.
Data correspond to usage on the plateform after 2015. The current usage metrics is available 48-96 hours after online publication and is updated daily on week days.
Initial download of the metrics may take a while.