Fig. 3
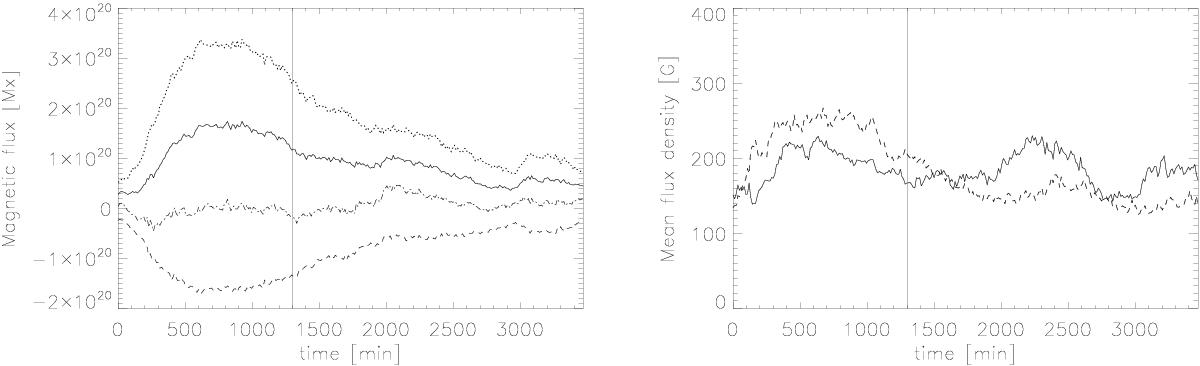
Left: computed magnetic flux on positive patches (solid line), on negative patches (dashed line), signed magnetic flux (dotted-dashed line), unsigned magnetic flux (dotted line). A vertical line marks the time of the flare at 21:43 UT. Right: mean values of the magnetic flux density of the positive (solid) and negative (dashed) regions.
Current usage metrics show cumulative count of Article Views (full-text article views including HTML views, PDF and ePub downloads, according to the available data) and Abstracts Views on Vision4Press platform.
Data correspond to usage on the plateform after 2015. The current usage metrics is available 48-96 hours after online publication and is updated daily on week days.
Initial download of the metrics may take a while.