Fig. 2
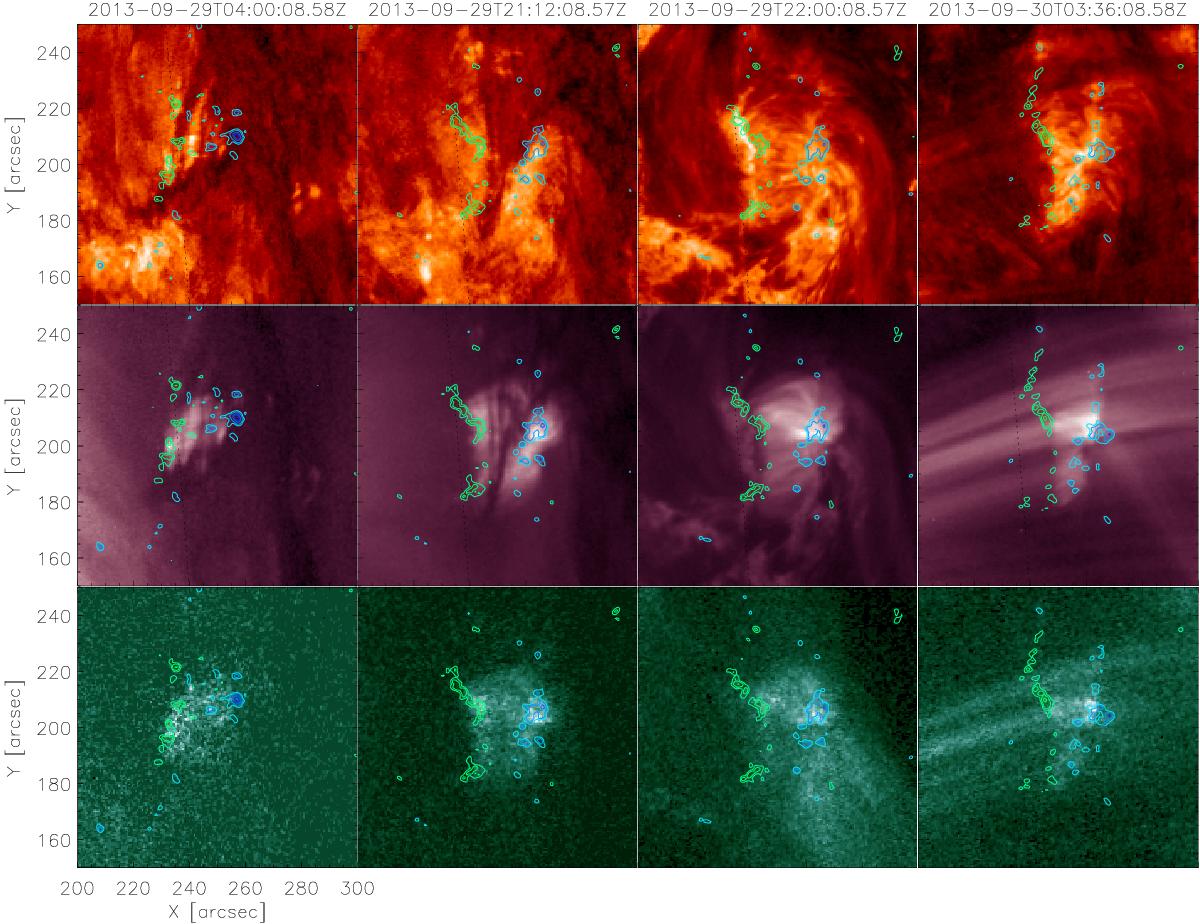
Top row: frame sequence of AIA 304 Å images of a filament’s barb (darker areas) with LOS-magnetic field superimposed. Different shades of green (from lighter to darker) contours mark different levels, as 90, 200, 500, 600, and 700 G, while a gamut of blue contours mark –90, –200, –500, –700, –900 G for the negative polarities. The frame size is 100′′× 100′′. Sequence timing aims to show the magnetic flux emergence (panel 1), pre-flare (panel 2), flare (panel 3), and decay (panel 4), from left to right. Bottom row: same temporal sequence in AIA 211 and 94 Å. An associated movie is available online.
Current usage metrics show cumulative count of Article Views (full-text article views including HTML views, PDF and ePub downloads, according to the available data) and Abstracts Views on Vision4Press platform.
Data correspond to usage on the plateform after 2015. The current usage metrics is available 48-96 hours after online publication and is updated daily on week days.
Initial download of the metrics may take a while.