Fig. 1
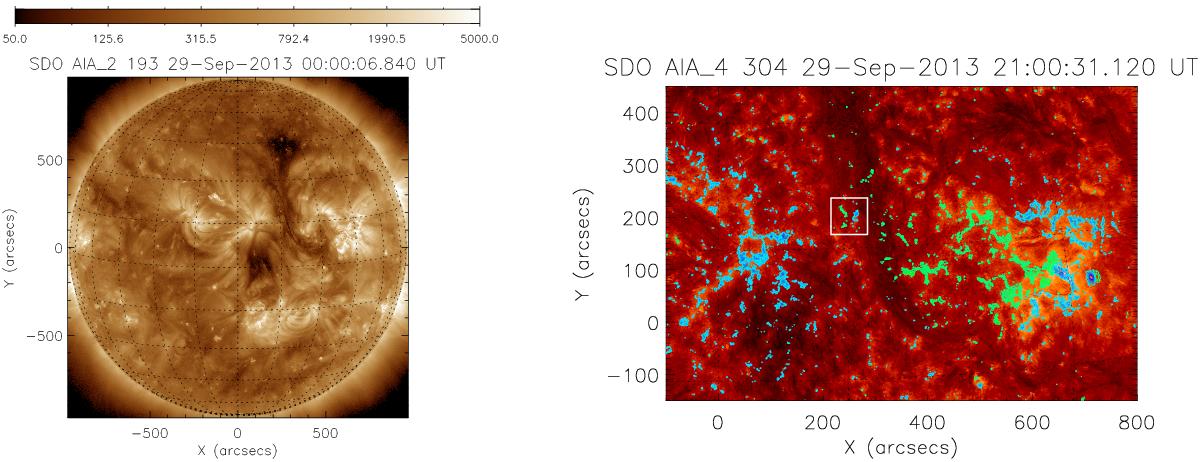
Context figures of the filament. The grid spaces mark 15°. Left: image in AIA 193 Å, on 2013 Sept. 29, at 00:00 UT. Image is clipped from 50 to 5000 DN. The filament is located on 20![]() N 15
N 15![]() W, with two coronal holes surrounding it on coordinates 40
W, with two coronal holes surrounding it on coordinates 40![]() N 20
N 20![]() W (CH1) and 0
W (CH1) and 0![]() N 7
N 7![]() W (CH2). Right: context image showing a derotated AIA 304 Å image displaying the filament, and the positive polarity (in green) and negative (blue). Different colour shades are explained in caption of Fig. 2. The bipolar flux emergence occurrence is located at [250′′, 200′′], enclosed in a white square. A movie available online shows the temporal evolution of the whole visible hemisphere from 21:00 to 22:09 UT in the AIA 304 Å channel. In the movie, the FOV of the right panel of this figure is marked by a black rectangle, and the emergence by a white square. The green and blue contours have the same meaning as in the right panel.
W (CH2). Right: context image showing a derotated AIA 304 Å image displaying the filament, and the positive polarity (in green) and negative (blue). Different colour shades are explained in caption of Fig. 2. The bipolar flux emergence occurrence is located at [250′′, 200′′], enclosed in a white square. A movie available online shows the temporal evolution of the whole visible hemisphere from 21:00 to 22:09 UT in the AIA 304 Å channel. In the movie, the FOV of the right panel of this figure is marked by a black rectangle, and the emergence by a white square. The green and blue contours have the same meaning as in the right panel.
Current usage metrics show cumulative count of Article Views (full-text article views including HTML views, PDF and ePub downloads, according to the available data) and Abstracts Views on Vision4Press platform.
Data correspond to usage on the plateform after 2015. The current usage metrics is available 48-96 hours after online publication and is updated daily on week days.
Initial download of the metrics may take a while.