Fig. 3
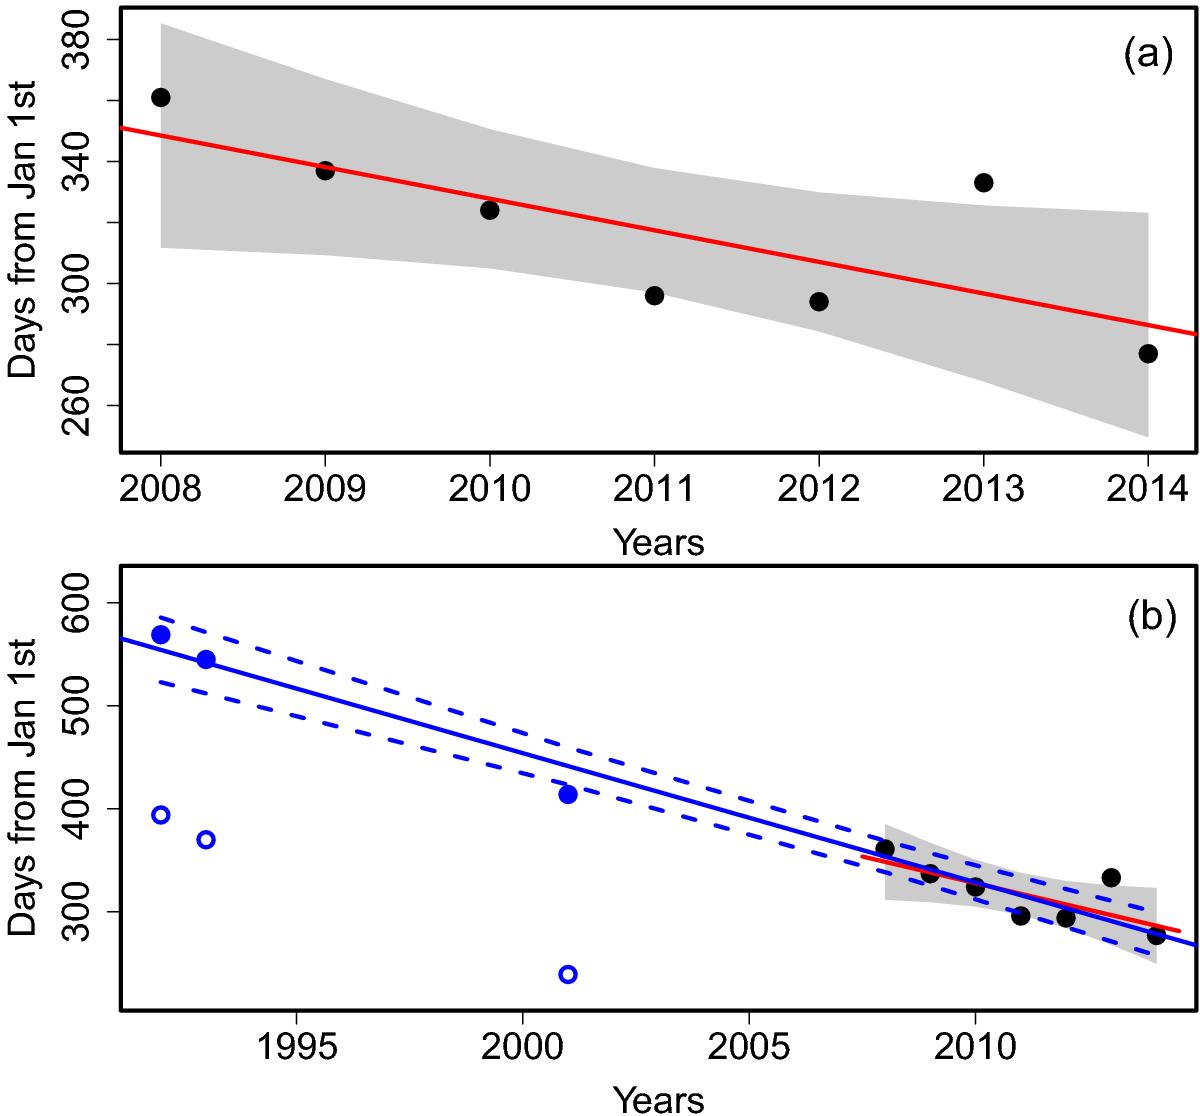
Distribution of eruption dates (in days of the year) over time, based on Table 1, for the optical detections only (panel a)) and for all detections (panel b)). The red line is the best fit to the optical data (in black). The grey area is the corresponding 95% confidence region. In panel b) the blue open circles are the optical peak dates corresponding to the X-ray detections (see the text). The blue filled circles are the same dates shifted by 175 d. The blue solid line is the best fit to all solid data points and the blue dashed lines mark its 95% confidence region.
Current usage metrics show cumulative count of Article Views (full-text article views including HTML views, PDF and ePub downloads, according to the available data) and Abstracts Views on Vision4Press platform.
Data correspond to usage on the plateform after 2015. The current usage metrics is available 48-96 hours after online publication and is updated daily on week days.
Initial download of the metrics may take a while.