Fig. 2
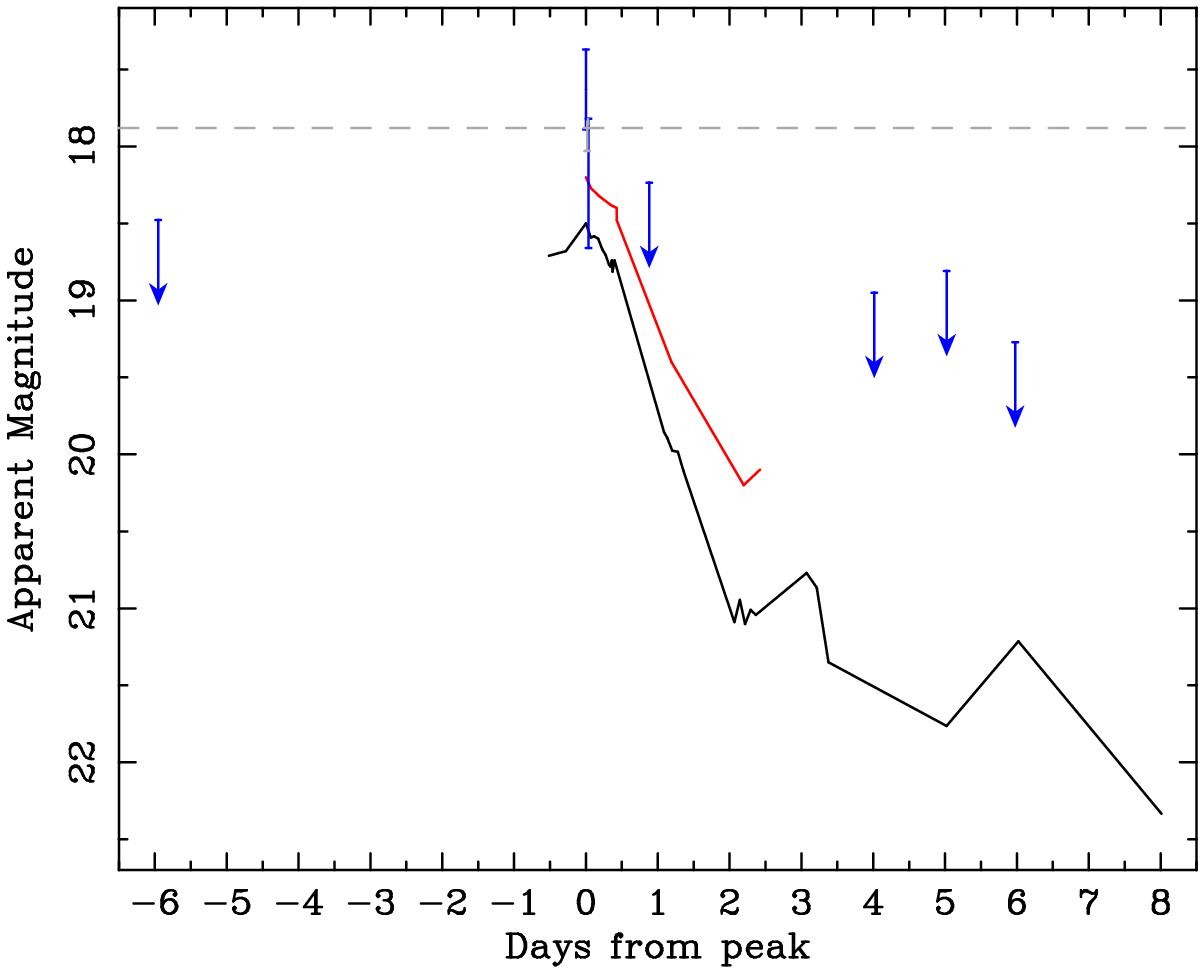
M31N 2008-12a eruption template light curves based on V-band (black line) and R-band (red line) photometry from the 2008, 2011, 2012, 2013, and 2014 eruptions (Darnley et al. 2014, 2015a). The blue points indicate photometry of the 2010 eruption data (here we have assumed that the Nov. 20.503 observation occurred at maximum light), the arrow heads indicate the 3σ upper limits from the non-detections, the tails the 5σ limits. The grey dashed line indicates the reference photometry of the nearby star J004528.55+415451.7.
Current usage metrics show cumulative count of Article Views (full-text article views including HTML views, PDF and ePub downloads, according to the available data) and Abstracts Views on Vision4Press platform.
Data correspond to usage on the plateform after 2015. The current usage metrics is available 48-96 hours after online publication and is updated daily on week days.
Initial download of the metrics may take a while.