Fig. 1
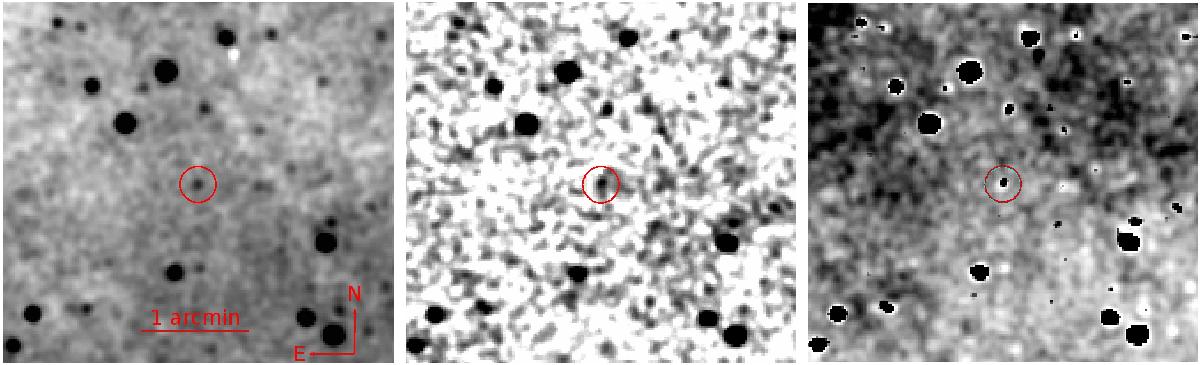
Comparison of the M31N 2008-12a detections in 2010 and 2012. Left: stacked, smoothed image of the 2012 detection based on the Miyaki-Argenteus data. Middle: stacked, background-subtracted, and smoothed image of the 2010 eruption combining the two detection images in Table 2. Right: astrometric overlay of the smoothed 2010 and 2012 stacks to show the positional coincidence. The 2012 image has been inverted and is in the background. The 2010 image has been saturated to enhance the contrast and its white channel turned transparent.
Current usage metrics show cumulative count of Article Views (full-text article views including HTML views, PDF and ePub downloads, according to the available data) and Abstracts Views on Vision4Press platform.
Data correspond to usage on the plateform after 2015. The current usage metrics is available 48-96 hours after online publication and is updated daily on week days.
Initial download of the metrics may take a while.