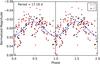
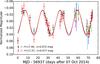
Fig. 5
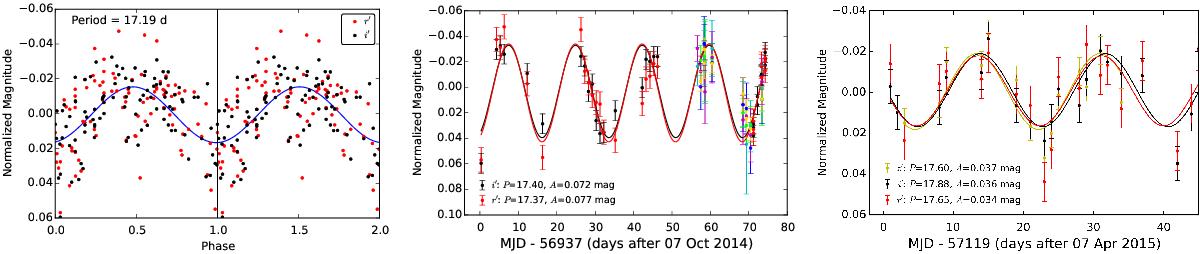
Left: phase curves in r and i derived with the Lafler-Kinman algorithm after removal of the long-term trend via a piece-wise linear function. Overplotted is a least squares fitted sine function (blue); the χ2 values are ~3.6 for the sine function and ~5.2 for a constant function at zero mag. Middle and right: light curves in the high state and the transition state after removal of the long-term trend via a piece-wise linear function. Overplotted on each light curve are fitted sine functions of period and amplitude as labeled. The χ2 values are ~2.2 for the sine functions, and for a constant function at zero mag ~10 (middle) and ~4 (right). The middle panel also shows the UKIRT data of Varricatt et al. (2015); Z,Y,J,H, and K in magenta, cyan, green, blue, and yellow, respectively.
Current usage metrics show cumulative count of Article Views (full-text article views including HTML views, PDF and ePub downloads, according to the available data) and Abstracts Views on Vision4Press platform.
Data correspond to usage on the plateform after 2015. The current usage metrics is available 48-96 hours after online publication and is updated daily on week days.
Initial download of the metrics may take a while.