Fig. 3
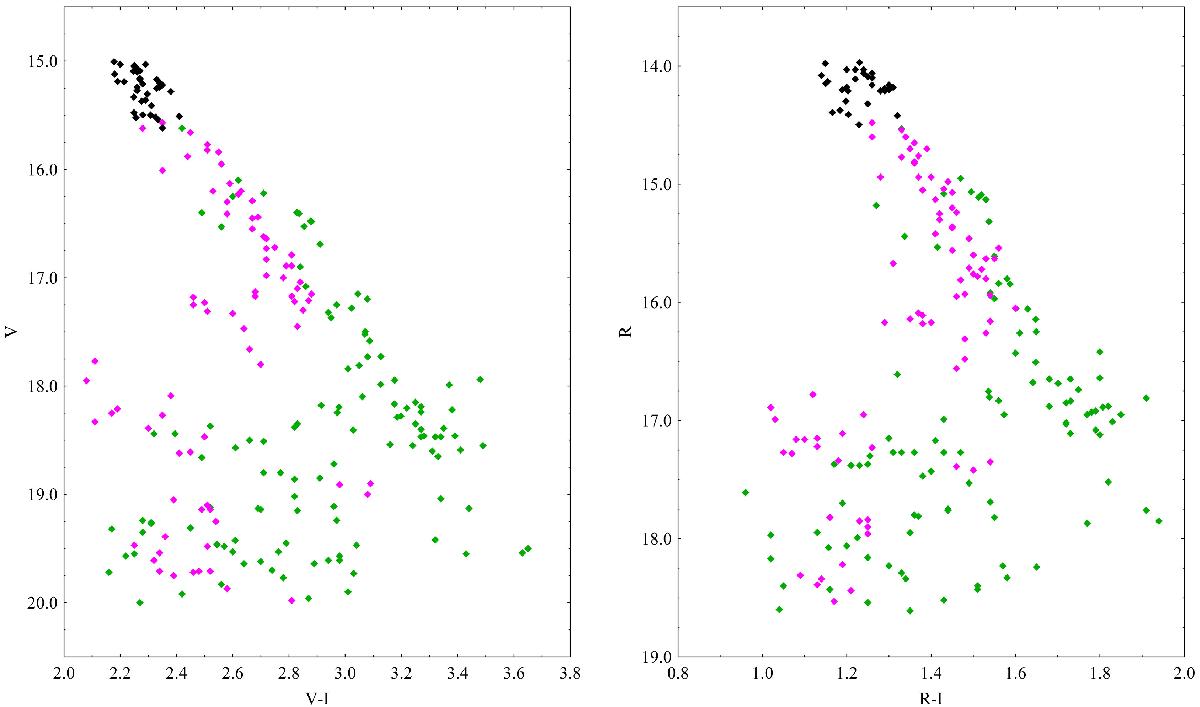
V/V−I and R/R−I diagrams for the period of our photometric observations. In the figure, the black diamonds denote observations from October 2000 to April 2003 (maximum level of brightness out of obscuration), the green diamonds observations from August 2003 to March 2010 (when the brightness of the star dropped) and the pink diamonds from August 2010 to April 2015 (when the brightness of the star increased).
Current usage metrics show cumulative count of Article Views (full-text article views including HTML views, PDF and ePub downloads, according to the available data) and Abstracts Views on Vision4Press platform.
Data correspond to usage on the plateform after 2015. The current usage metrics is available 48-96 hours after online publication and is updated daily on week days.
Initial download of the metrics may take a while.