Fig. 5
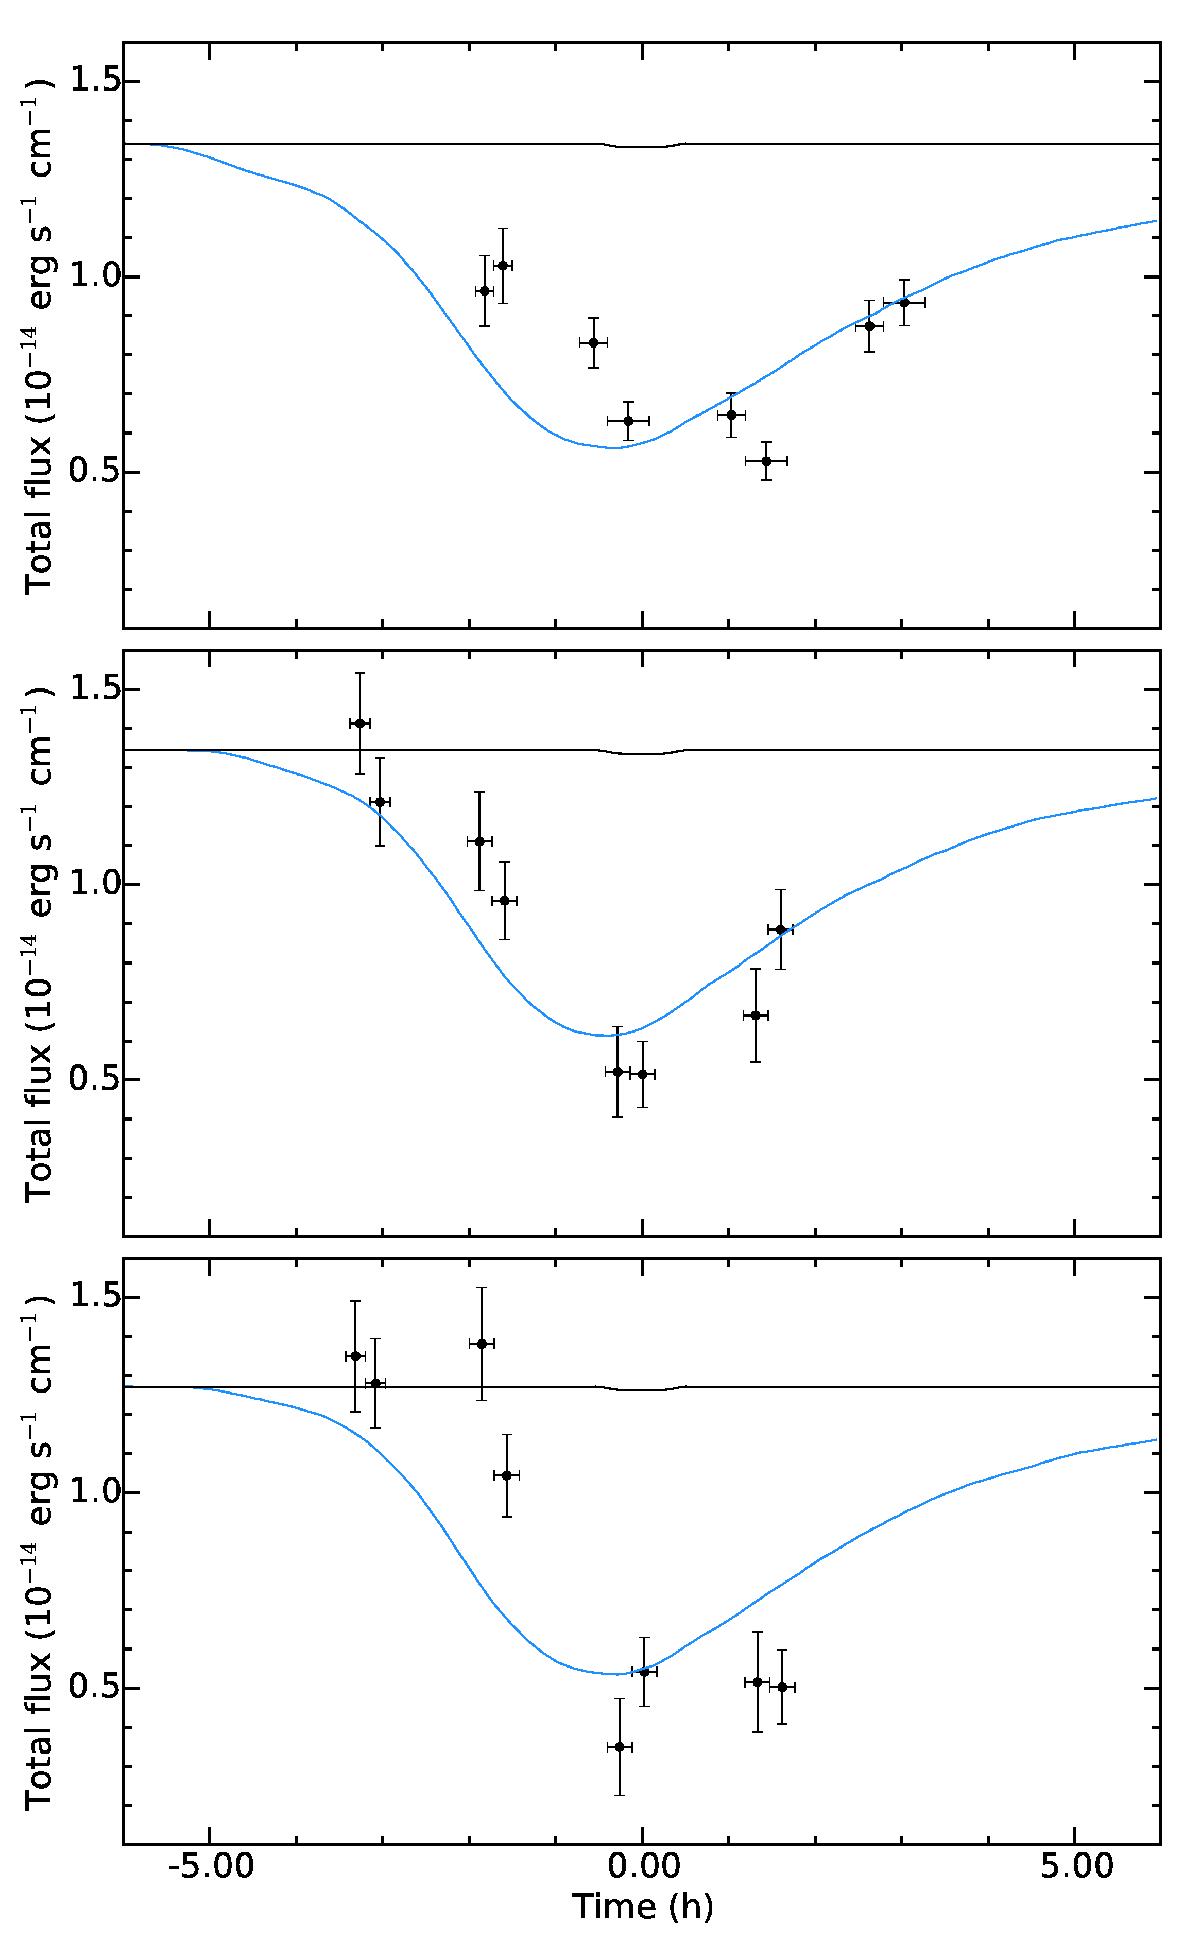
Transit light curves of the Lyman-α line in Visit 1 (upper panel), Visit 2 (middle panel), and Visit 3 (lower panel), integrated between –120 and –40 km s-1. Black points correspond to the observations, while the black line shows the optical transit. The blue lines corresponds to best-fit simulations when the exosphere is subjected to stellar gravity and radiation pressure alone.
Current usage metrics show cumulative count of Article Views (full-text article views including HTML views, PDF and ePub downloads, according to the available data) and Abstracts Views on Vision4Press platform.
Data correspond to usage on the plateform after 2015. The current usage metrics is available 48-96 hours after online publication and is updated daily on week days.
Initial download of the metrics may take a while.