Fig. 4
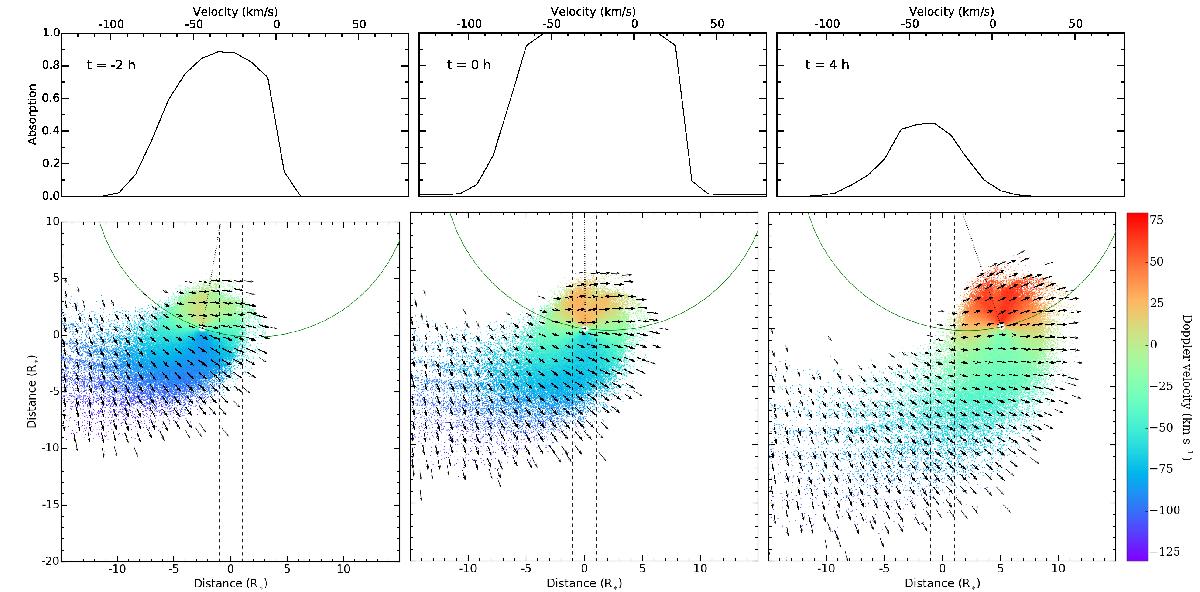
Views of GJ 436 b exosphere (lower panels) and its theoretical absorption profile, as it would be observed close to the star (upper panels). We caution that absorption in the range [–40; 20] km s-1 cannot be observed from Earth, and that STIS LSF would spread this absorption signal over several pixels. Time increases from left to right and is indicated on each plot. The dashed black lines limit the LOS toward the stellar surface, while the dotted line indicates the star-planet axis. Black arrows show the velocity field of the H0 atoms relative to the star. Gas is seen in the orbital plane and colored as a function of its velocity projected on the LOS. Left panel: as they circumvent the planet to move away from the star, atoms in the front of the coma absorb the stellar flux at blueshifted velocities before the optical transit. Middle panel: at the time of the optical transit the strongest absorption comes from the core of the coma, and is centered on the projection of the planet orbital velocity at –16 km s-1. The outer regions of the exospheric tail contribute to absorption at higher velocities in the blue wing. Right panel: after the optical transit, absorption in the blue wing of the line comes exclusively from the tail.
Current usage metrics show cumulative count of Article Views (full-text article views including HTML views, PDF and ePub downloads, according to the available data) and Abstracts Views on Vision4Press platform.
Data correspond to usage on the plateform after 2015. The current usage metrics is available 48-96 hours after online publication and is updated daily on week days.
Initial download of the metrics may take a while.