Fig. 1
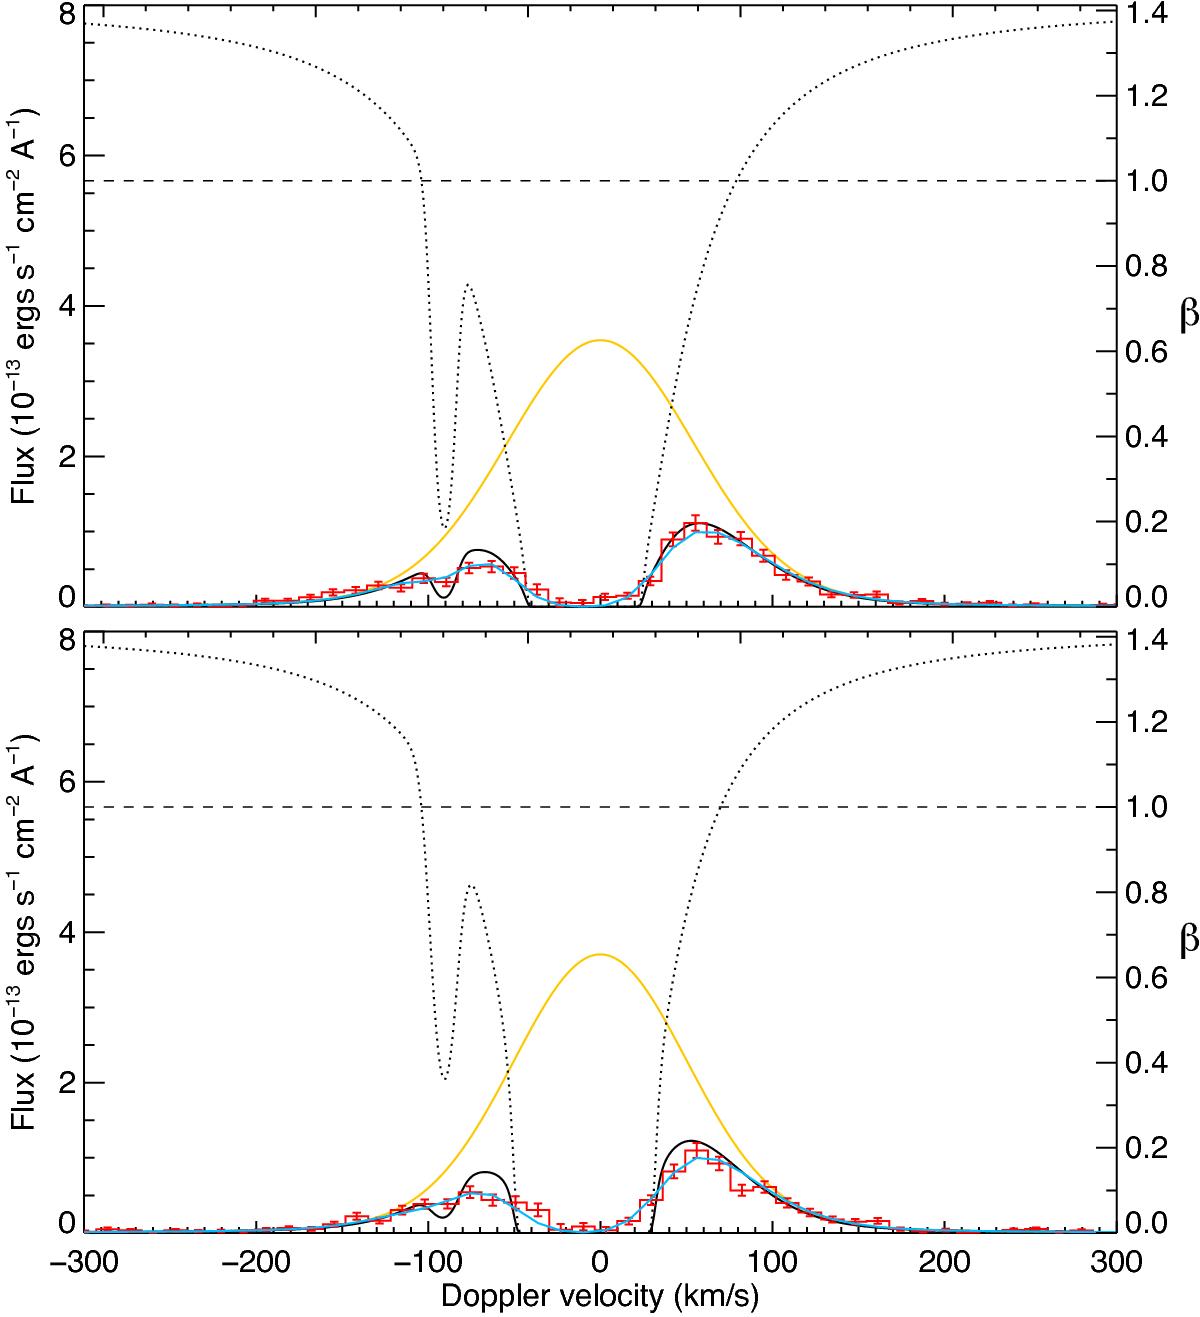
Lyman-α line profiles of GJ 436 for Visits 2 (top) and 3 (bottom). The yellow line shows the theoretical intrinsic stellar emission line profile as seen by hydrogen atoms escaping the planetary atmosphere, scaled to the Earth distance. It also corresponds to the profile of the ratio β between radiation pressure and stellar gravity (values reported on the right axis). The solid black line shows the Lyman-α line profile after absorption by the interstellar hydrogen (1215.6 Å) and deuterium (1215.25 Å), whose cumulated profile is plotted as a dotted black line (ISM absorption in the range 0–1 has been scaled to the entire vertical axis range). The line profile convolved with the LSF (blue line) is compared to the observations shown as a red histogram. Above the horizontal dashed line (β = 1), radiation pressure would overcome stellar gravity and accelerate particles away from the star. However with β values below unity, radiation pressure from GJ 436 can only brake the gravitational deviation of particles toward the star.
Current usage metrics show cumulative count of Article Views (full-text article views including HTML views, PDF and ePub downloads, according to the available data) and Abstracts Views on Vision4Press platform.
Data correspond to usage on the plateform after 2015. The current usage metrics is available 48-96 hours after online publication and is updated daily on week days.
Initial download of the metrics may take a while.