Free Access
Fig. 7
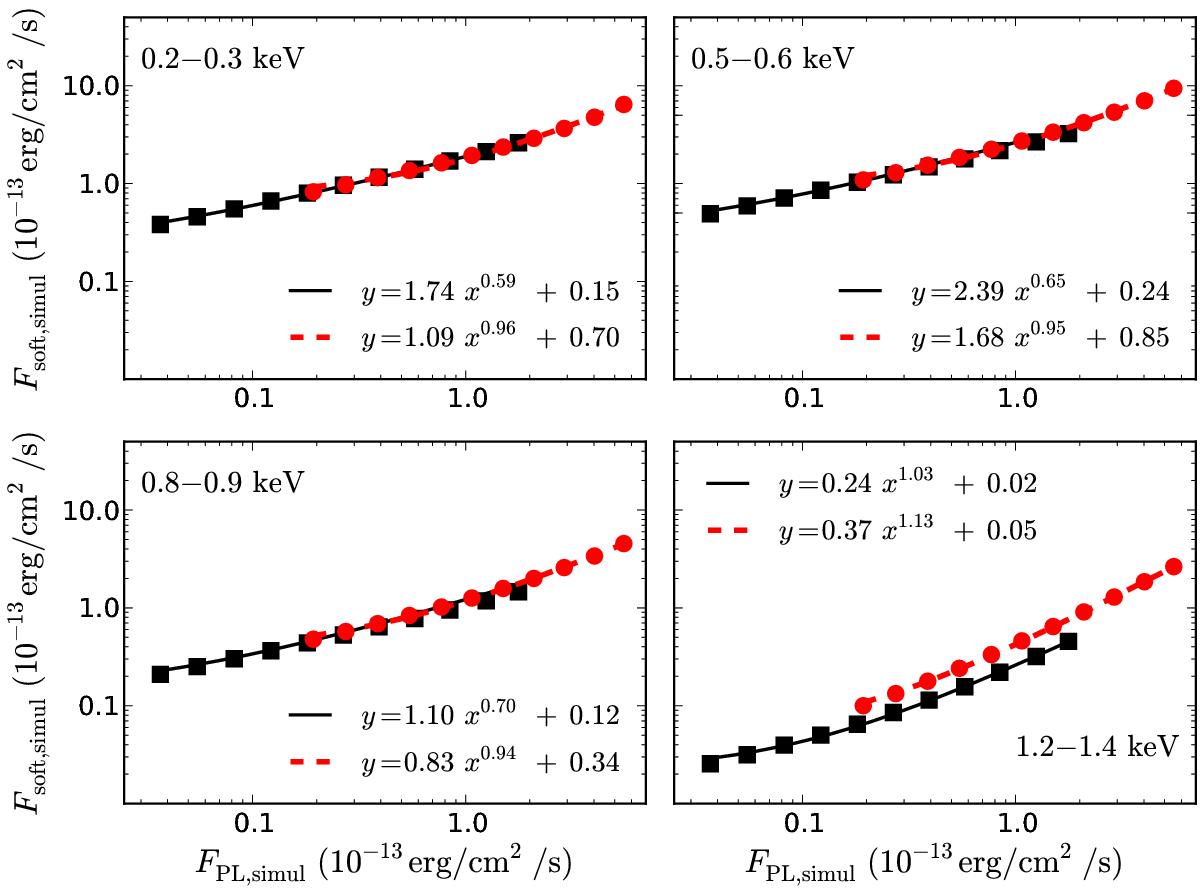
Fsoft,simul as a function of FPL,simul in the high-flux and low-flux variability cases (red circles and black squares, respectively). The FPPs were fitted with a PLc model (dashed red line and solid black line for the high- and low-flux cases, respectively).
Current usage metrics show cumulative count of Article Views (full-text article views including HTML views, PDF and ePub downloads, according to the available data) and Abstracts Views on Vision4Press platform.
Data correspond to usage on the plateform after 2015. The current usage metrics is available 48-96 hours after online publication and is updated daily on week days.
Initial download of the metrics may take a while.