Fig. 6
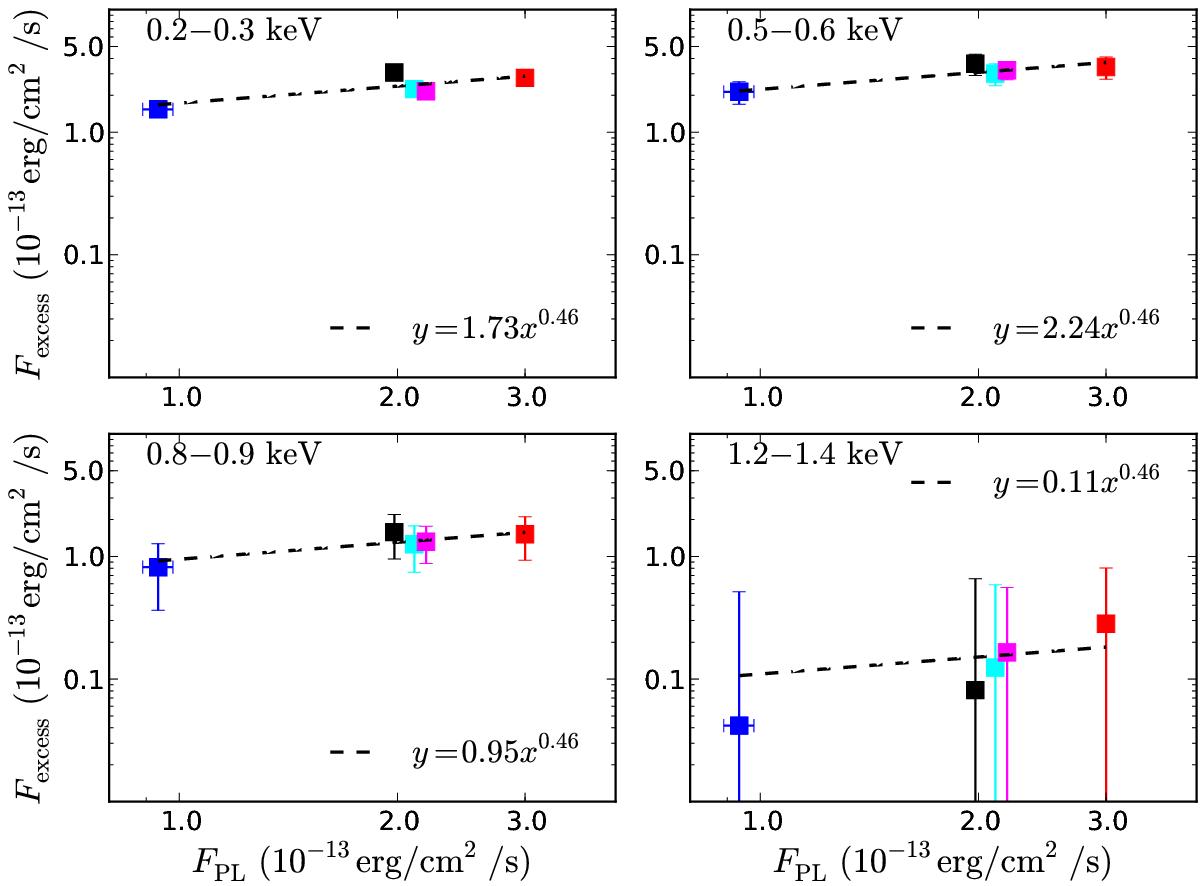
Fexcess,obs plotted as a function of FPL,obs, for Obs.1, 2, 3, 4, and 5 (black, red, cyan, blue, and magenta squares, respectively). The errors on the points were calculated using the efluxer flux error and the error on the best-fit slope, and normalisation of the PL model fit to the 1.7–3 keV data. The dashed lines indicate the best-fit PL model fits to the data.
Current usage metrics show cumulative count of Article Views (full-text article views including HTML views, PDF and ePub downloads, according to the available data) and Abstracts Views on Vision4Press platform.
Data correspond to usage on the plateform after 2015. The current usage metrics is available 48-96 hours after online publication and is updated daily on week days.
Initial download of the metrics may take a while.