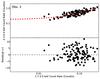
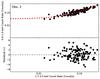
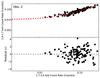
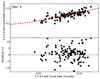
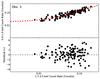
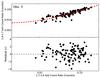
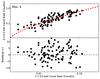
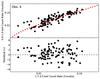
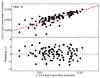
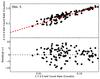
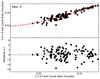
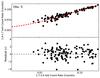
Fig. 4
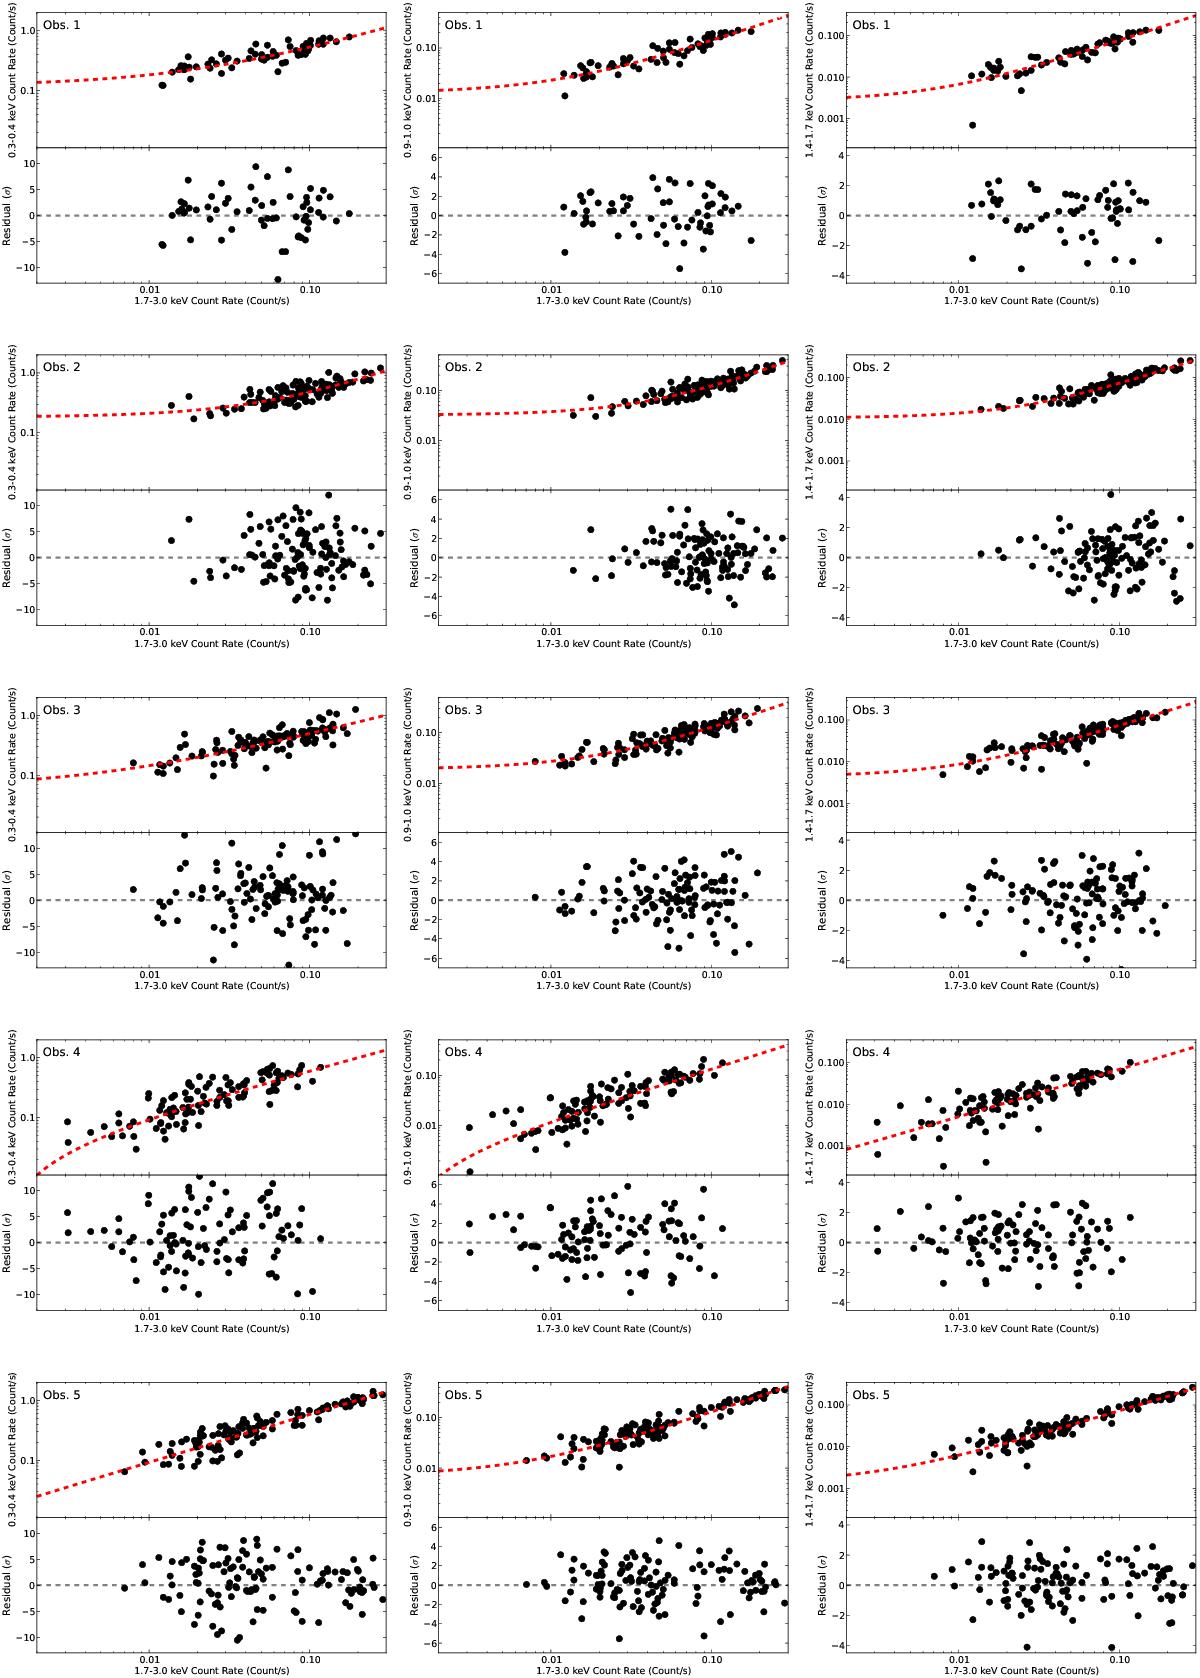
0.3–0.4, 0.9–1, and 1.4–1.7 vs. 1.7–3 keV FFPs (left, middle, and right columns, respectively) for all observations obtained for a bin size of 1 ks. The dashed red line indicates the best-fit PLc relation. The best-fit residuals are plotted in the lower plan of each plot. The errors are similar to those plotted in Fig. 2 but were not plotted for clarity reasons.
Current usage metrics show cumulative count of Article Views (full-text article views including HTML views, PDF and ePub downloads, according to the available data) and Abstracts Views on Vision4Press platform.
Data correspond to usage on the plateform after 2015. The current usage metrics is available 48-96 hours after online publication and is updated daily on week days.
Initial download of the metrics may take a while.