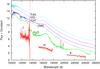
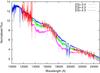
Fig. 6

Left: identification of the main molecular features formed the observed by LIRIS infrared spectrum of the B component, model atmosphere 3200/5.0/–1.5∗. “Vald” marks the synthetic spectrum computed for atomic line list. H, J, K mark three spectral ranges observed by LIRIS. Right: fit of our synthetic spectra computed with the same model atmosphere, but different oxygen abundances, to the observed SED of G 224-58 B.
Current usage metrics show cumulative count of Article Views (full-text article views including HTML views, PDF and ePub downloads, according to the available data) and Abstracts Views on Vision4Press platform.
Data correspond to usage on the plateform after 2015. The current usage metrics is available 48-96 hours after online publication and is updated daily on week days.
Initial download of the metrics may take a while.