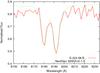
Fig. 5
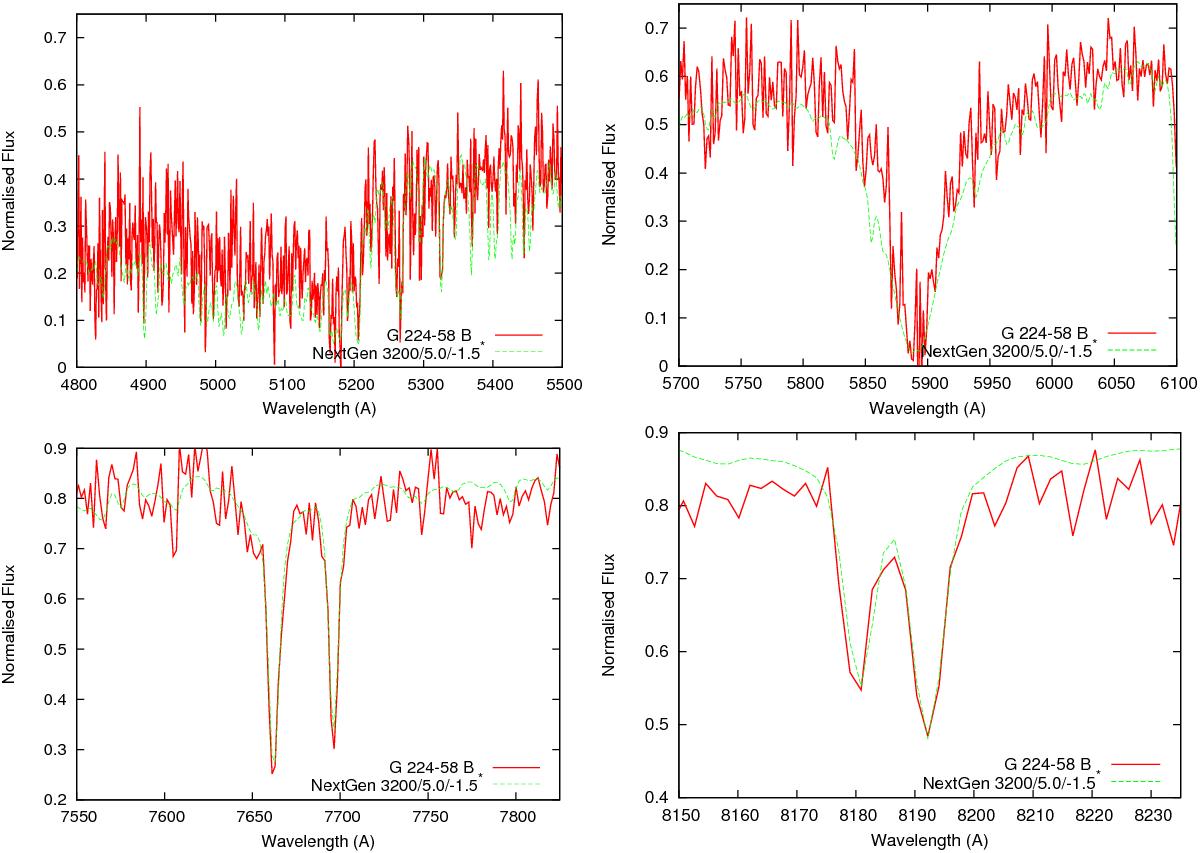
Fits of some spectral details in our theoretical spectra shown in the right panel of Fig. 4 to the observed features in G 224-58 B spectrum: MgH A2Π − X2Σ+ band system at 5200 Å (top left), lines of Na I resonance doublet (top right), lines of resonance doublet of K I (bottom left), subordinate lines of Na I (bottom right). Model atmosphere and normalisation point are the same as for Fig. 4.
Current usage metrics show cumulative count of Article Views (full-text article views including HTML views, PDF and ePub downloads, according to the available data) and Abstracts Views on Vision4Press platform.
Data correspond to usage on the plateform after 2015. The current usage metrics is available 48-96 hours after online publication and is updated daily on week days.
Initial download of the metrics may take a while.