Fig. 9
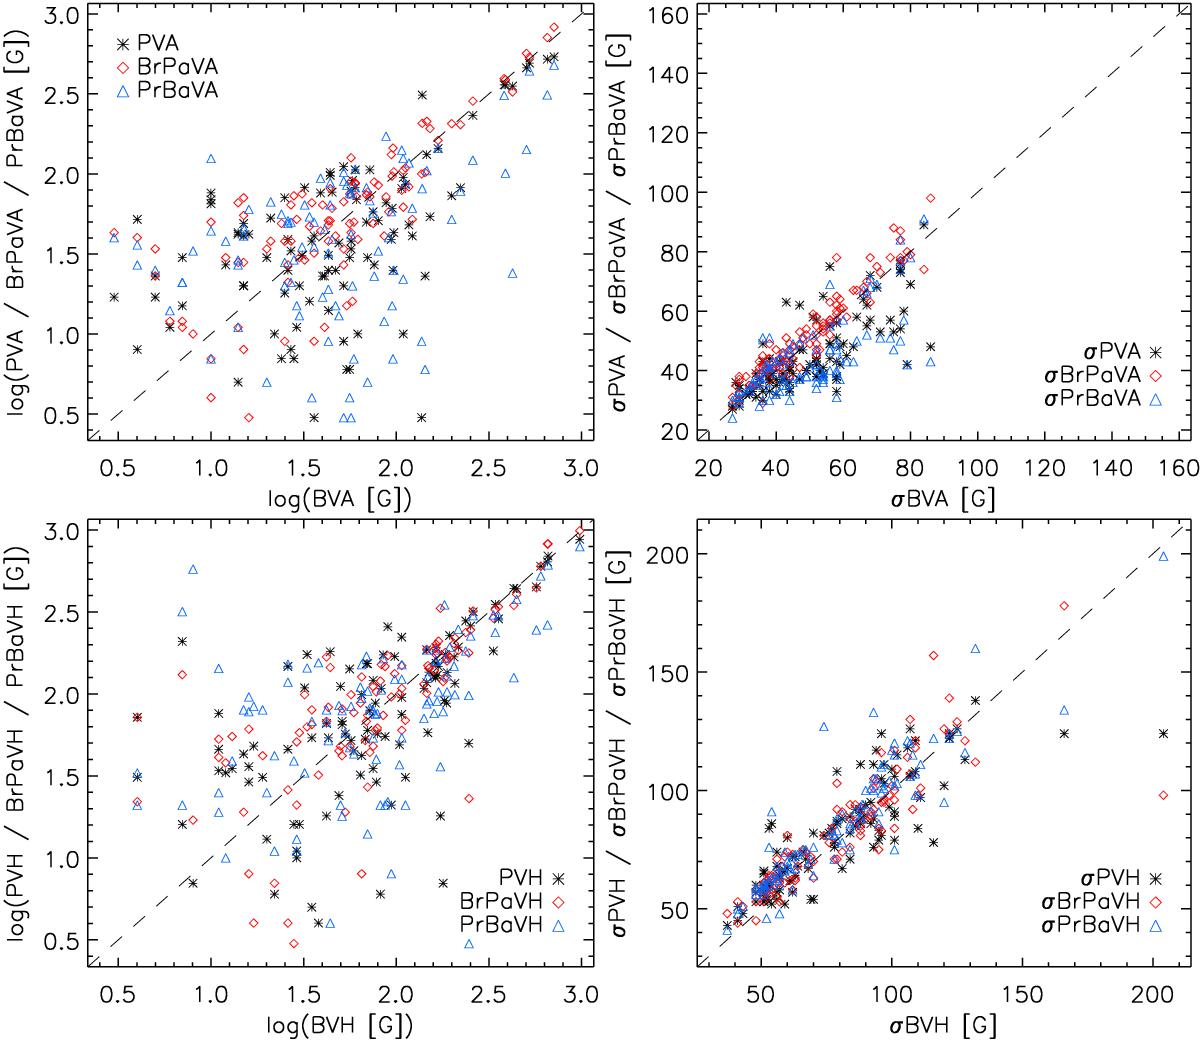
Top left panel: comparison between the |⟨ Bz ⟩| values obtained by analysing the whole spectrum with the Bonn pipeline (BVA) and i) the Potsdam pipeline (PVA, black asterisks); ii) the Potsdam pipeline, but reducing the data with the Bonn pipeline (BrPaVA, blue triangles); iii) the Bonn pipeline, but reducing the data with the Potsdam pipeline (PrBaVA, red rhombs). Top right panel: same as top left panel, but for the uncertainties on the ⟨ Bz ⟩ values. Bottom left panel: same as top left panel, but for the |⟨ Bz ⟩| values obtained analysing the hydrogen lines. Bottom right panel: same as bottom left panel, but for the uncertainties on the ⟨ Bz ⟩ values. The meaning of each acronym used in the labels and legends of each panel (e.g., BVH) can be found in the header of Tables 3 and 4.
Current usage metrics show cumulative count of Article Views (full-text article views including HTML views, PDF and ePub downloads, according to the available data) and Abstracts Views on Vision4Press platform.
Data correspond to usage on the plateform after 2015. The current usage metrics is available 48-96 hours after online publication and is updated daily on week days.
Initial download of the metrics may take a while.