Fig. 4
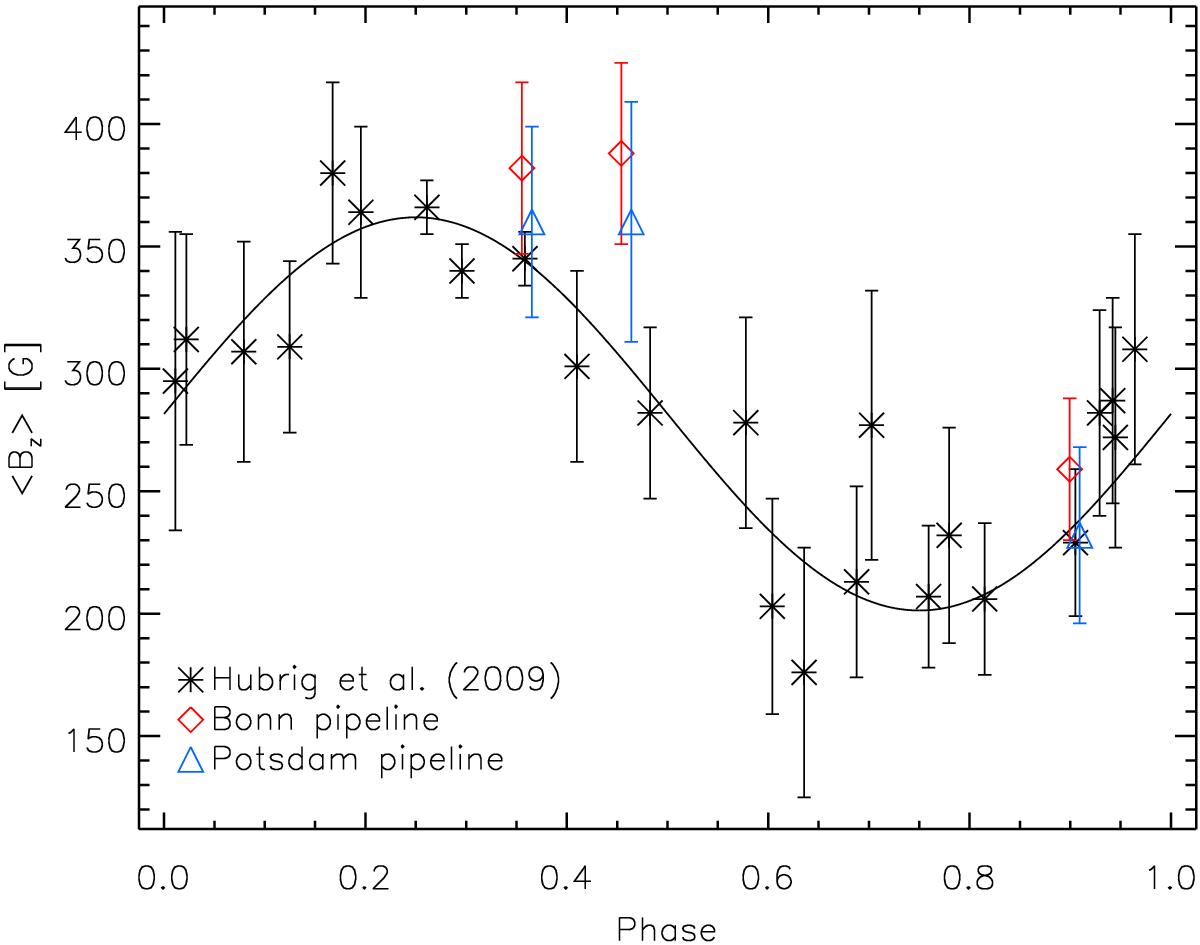
Phase plot of the ⟨ Bz ⟩ values obtained for HD 46328 from the FORS1 (black asterisks; Hubrig et al. 2009) and FORS2 (red rhombs: Bonn pipeline, blue triangles: Potsdam pipeline; using the whole spectrum) data, and the sine wave function calculated using the magnetic field model given by Hubrig et al. (2011). A slight phase shift has been applied between our two sets of FORS2 measurements for visualisation purposes.
Current usage metrics show cumulative count of Article Views (full-text article views including HTML views, PDF and ePub downloads, according to the available data) and Abstracts Views on Vision4Press platform.
Data correspond to usage on the plateform after 2015. The current usage metrics is available 48-96 hours after online publication and is updated daily on week days.
Initial download of the metrics may take a while.