Fig. 7
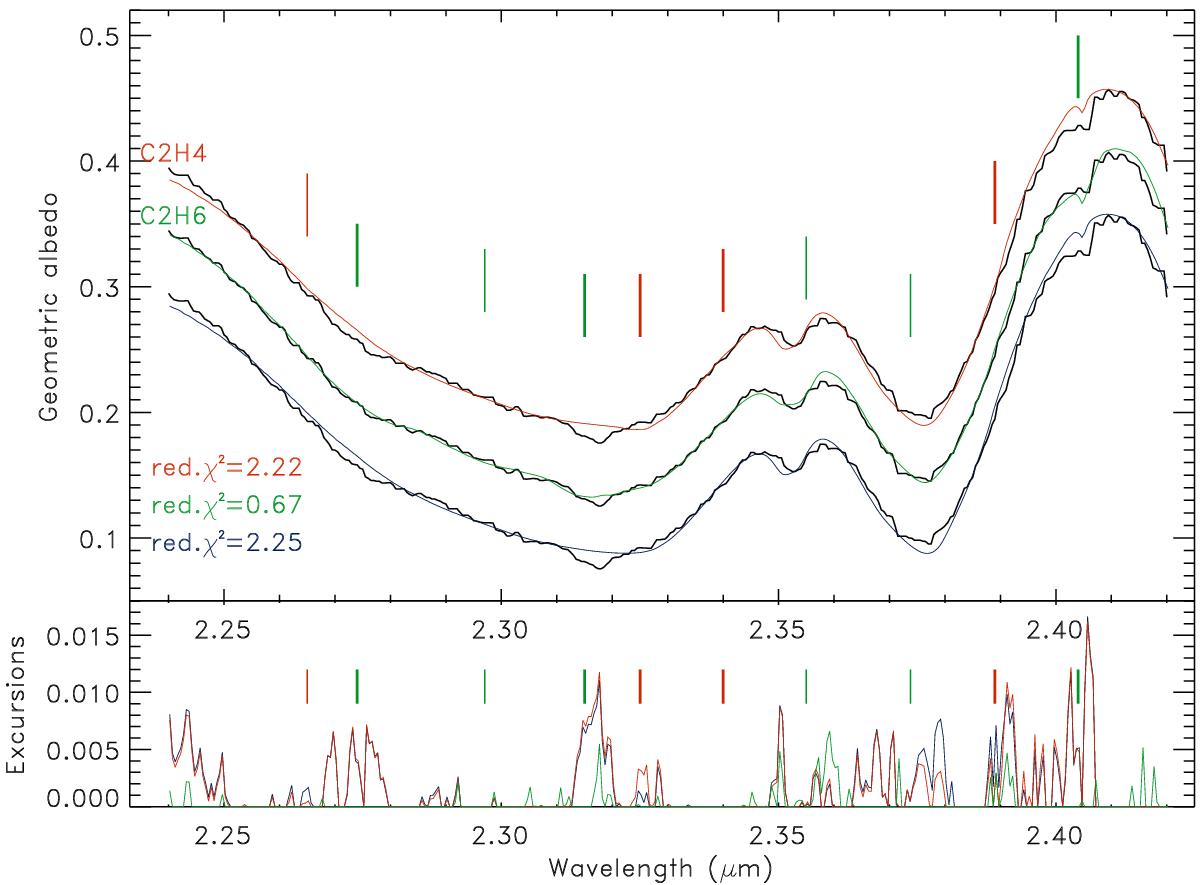
Results of the spectral modeling in the [2.24−2.42] μm range. In black lines, spectrum of Pluto converted in albedo obtained at SEEL = 5°. From bottom to top, synthetic spectra obtained using the previous model (in blue), using additional ethane (in green), and additional ethylene (in red). These best-fit models have been shifted by +0, +0.05 and +0.1, respectively, for clarity. The bottom panel presents excursions of the models when greater than the observational error defined at 1σ level. Vertical segments are located at the band peak position of ethane (in green) and ethylene (in red) features. The thicker segments represent the deepest bands of each chemical compound.
Current usage metrics show cumulative count of Article Views (full-text article views including HTML views, PDF and ePub downloads, according to the available data) and Abstracts Views on Vision4Press platform.
Data correspond to usage on the plateform after 2015. The current usage metrics is available 48-96 hours after online publication and is updated daily on week days.
Initial download of the metrics may take a while.