Fig. 5
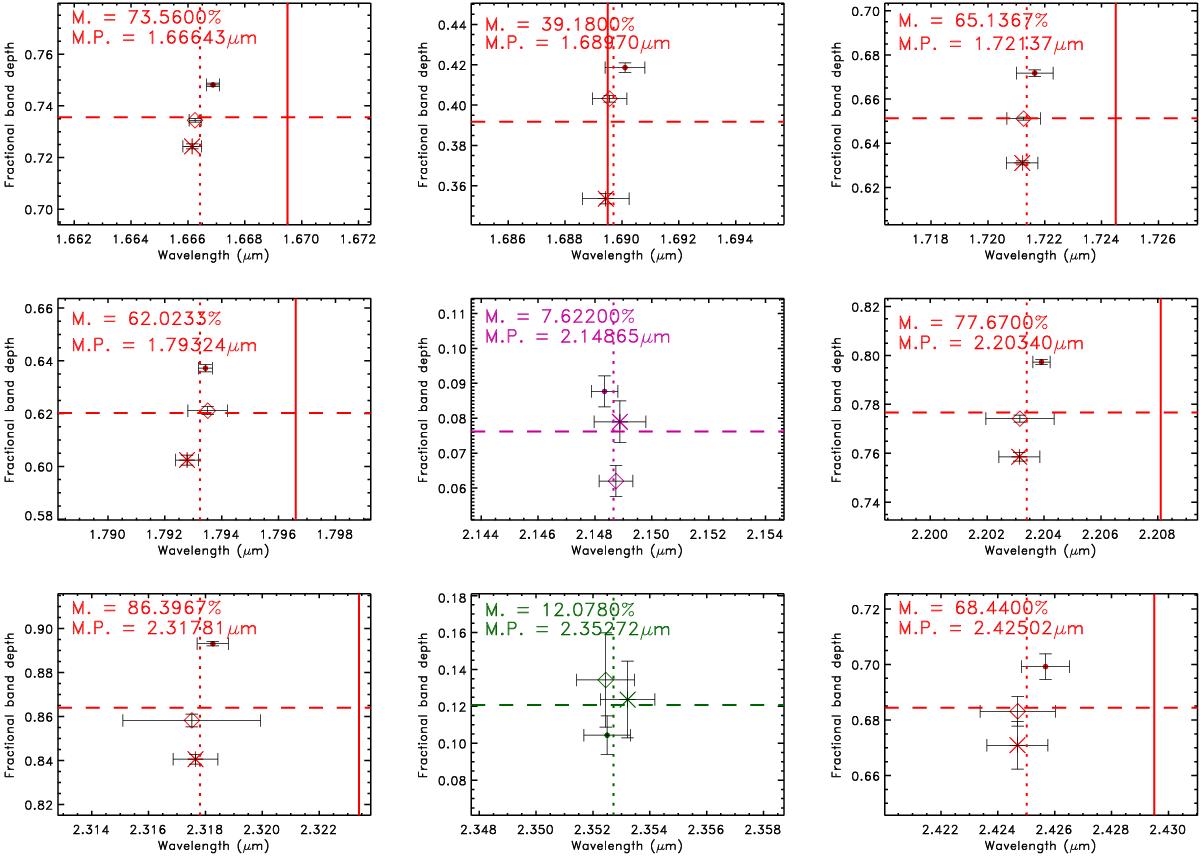
Band peak location and equivalent band depth of the main absorption features. Band of methane ice is plotted in red, that of N2 and CO, in purple and green, respectively. The results for data at sub-Earth east longitude of 5°, 41°, and 111° are represented with dots, diamonds, and crosses, respectively. Vertical dotted and full lines represent the computed mean band peak position and the position of pure methane ice as reported by Quirico & Schmitt (1997b) when applicable, respectively. The horizontal dashed line provides the computed mean equivalent absorption band depth. M. and M.P. give the mean fractional band depth and the mean band peak position, respectively.
Current usage metrics show cumulative count of Article Views (full-text article views including HTML views, PDF and ePub downloads, according to the available data) and Abstracts Views on Vision4Press platform.
Data correspond to usage on the plateform after 2015. The current usage metrics is available 48-96 hours after online publication and is updated daily on week days.
Initial download of the metrics may take a while.