Fig. 4
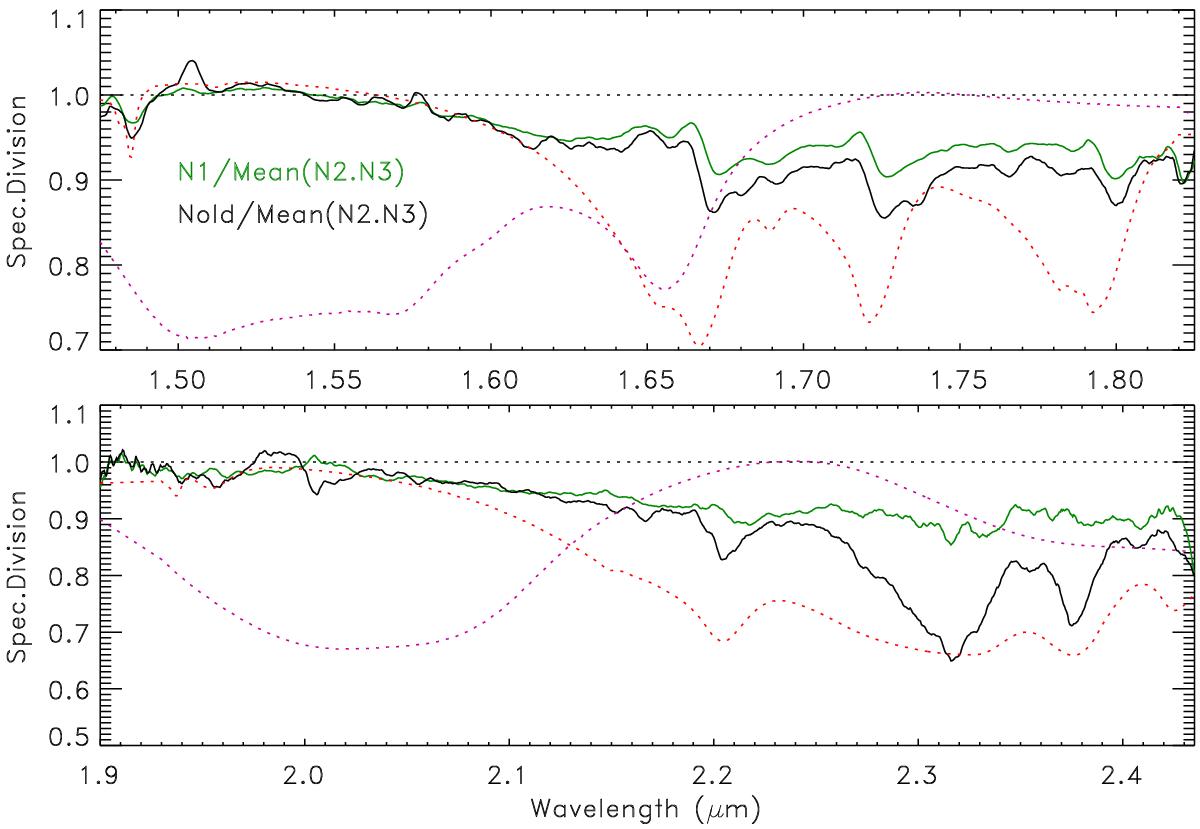
Division of the normalized spectra presented in Fig. 3. N1, N2, N3, Nold refer to spectra obtained on July 17th 2014 (SEEL = 41°), July 22th 2014 (SEEL = 121°), August 17th 2014 (SEEL = 101°), and April 13th 2008 (SEEL = 5°), respectively. Synthetic spectra of water ice and methane ice have been added (in purple and red dashed lines, respectively).
Current usage metrics show cumulative count of Article Views (full-text article views including HTML views, PDF and ePub downloads, according to the available data) and Abstracts Views on Vision4Press platform.
Data correspond to usage on the plateform after 2015. The current usage metrics is available 48-96 hours after online publication and is updated daily on week days.
Initial download of the metrics may take a while.