Fig. 6

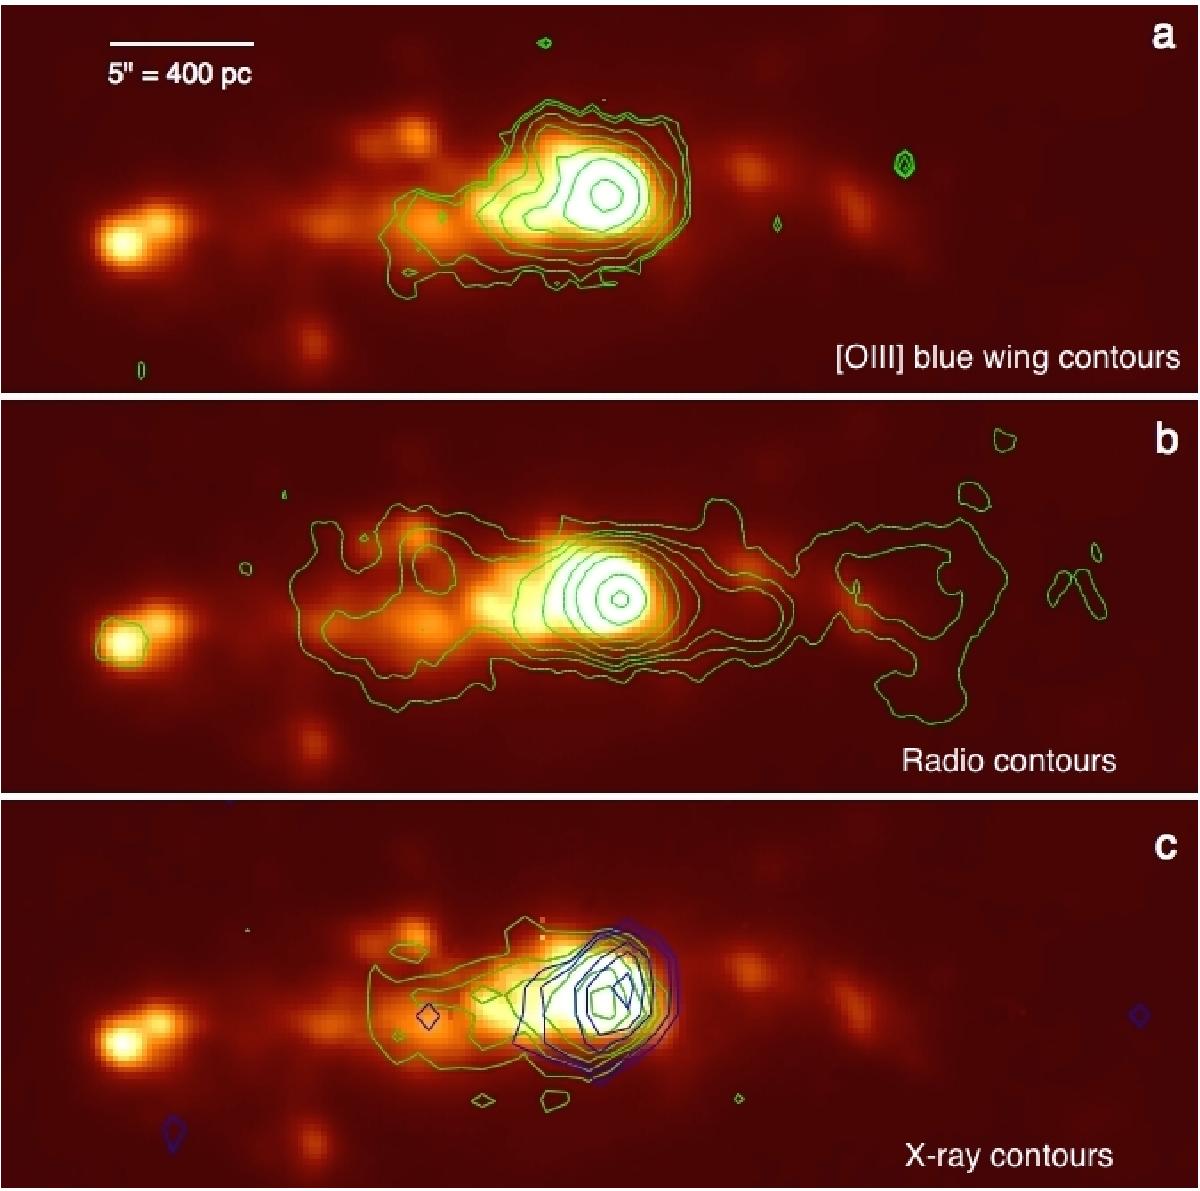
Outflowing gas in the core of NGC 5643. Panel a) Hα map of the central region, with superimposed the contours of the flux in the blue wing (v< −400 km s-1) of the [OIII]λ4959 emission line, tracing the high velocity outflowing ionized gas. Panel b) Hα map with superimposed the 8.4 GHz radio contours from the VLA observations presented in Leipski et al. 2006 . The diffuse radio jet is coincident with the location of the blue [OIII]λ4959 wing. Panel c) Hα map with superimposed Chandra X-ray contours, 0.3–0.5 keV shown in green, and 0.5–8 keV shown in blue. While the high energy data are only located in the nuclear region, the lower energy channels show extended emission compatible with an outflowing jet. Again, the location of the jet traced by X-rays corresponds to the ionized gas and radio emitting gas, and points toward the star-forming blue clump, suggesting a possible connection between the star-forming episode and the outflowing material.
Current usage metrics show cumulative count of Article Views (full-text article views including HTML views, PDF and ePub downloads, according to the available data) and Abstracts Views on Vision4Press platform.
Data correspond to usage on the plateform after 2015. The current usage metrics is available 48-96 hours after online publication and is updated daily on week days.
Initial download of the metrics may take a while.


