Fig. 4

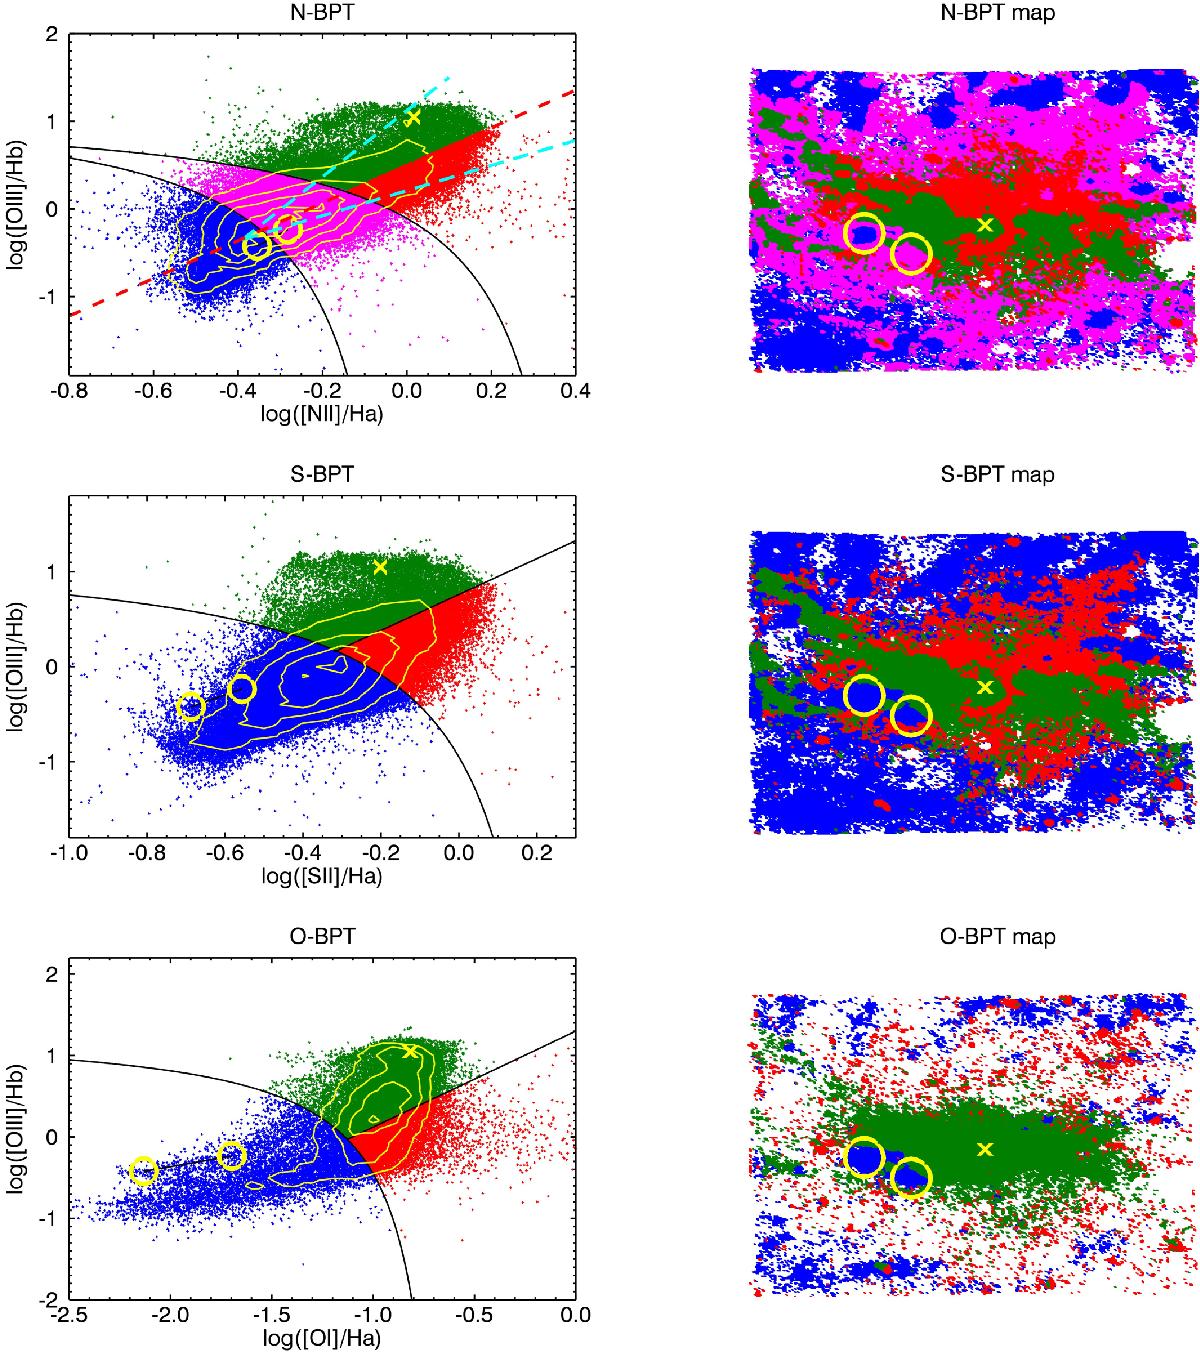
Resolved BPT diagrams for the nuclear region of NGC 5643. The N-BPT ([NII]λ6584/Hα vs. [OIII]λ5007/Hβ, upper panels), S-BPT ([SII]λ6716, 30/Hα vs. [OIII]λ5007/Hβ, central panels) and O-BPT [OI]λ6300/Hα vs. [OIII]λ5007/Hβ, lower panels) diagrams for each spaxel with S/N> 3 in each line are shown on the left, along with contours showing the density of the points on the diagram. The location of the Hα bright clumps A and B, as derived from an integrated spectrum extracted on a region of 1.6 × 1.6′′, is shown with a yellow circle, while a cross marks the location of the nucleus. The dashed cyan lines in the N-BPT mark the location of points for the shock-excited region of NGC 1482 and for the AGN-excited emission of NGC 1365 from Sharp & Bland-Hawthorn 2010. The bisector between the two, marked with a dashed red line, divide AGN-dominated by shock-dominated regions. A map marking each spaxel with the color corresponding to the dominant excitation at its location is shown on the right, again for spaxels with S/N> 3. The star-forming regions are marked in blue, the Seyfert-type ionization is shown in green, LINER- or shock-dominated regions are shown in red, and intermediate regions are shown in magenta in the N-BPT. Star-forming regions are prevalent in the outer part of the MUSE field of view, AGN ionization is dominating in the core and in the ionization cone, while shock excitated gas is prevalent around the EELR and the cone. The nucleus is marked with a cross, and the Hα bright clups A and B are marked with a yellow circle. Clump A is dominated by star formation in all the three diagrams, while Clump B is classified as intermediate by the N-BPT.
Current usage metrics show cumulative count of Article Views (full-text article views including HTML views, PDF and ePub downloads, according to the available data) and Abstracts Views on Vision4Press platform.
Data correspond to usage on the plateform after 2015. The current usage metrics is available 48-96 hours after online publication and is updated daily on week days.
Initial download of the metrics may take a while.


