Fig. 3

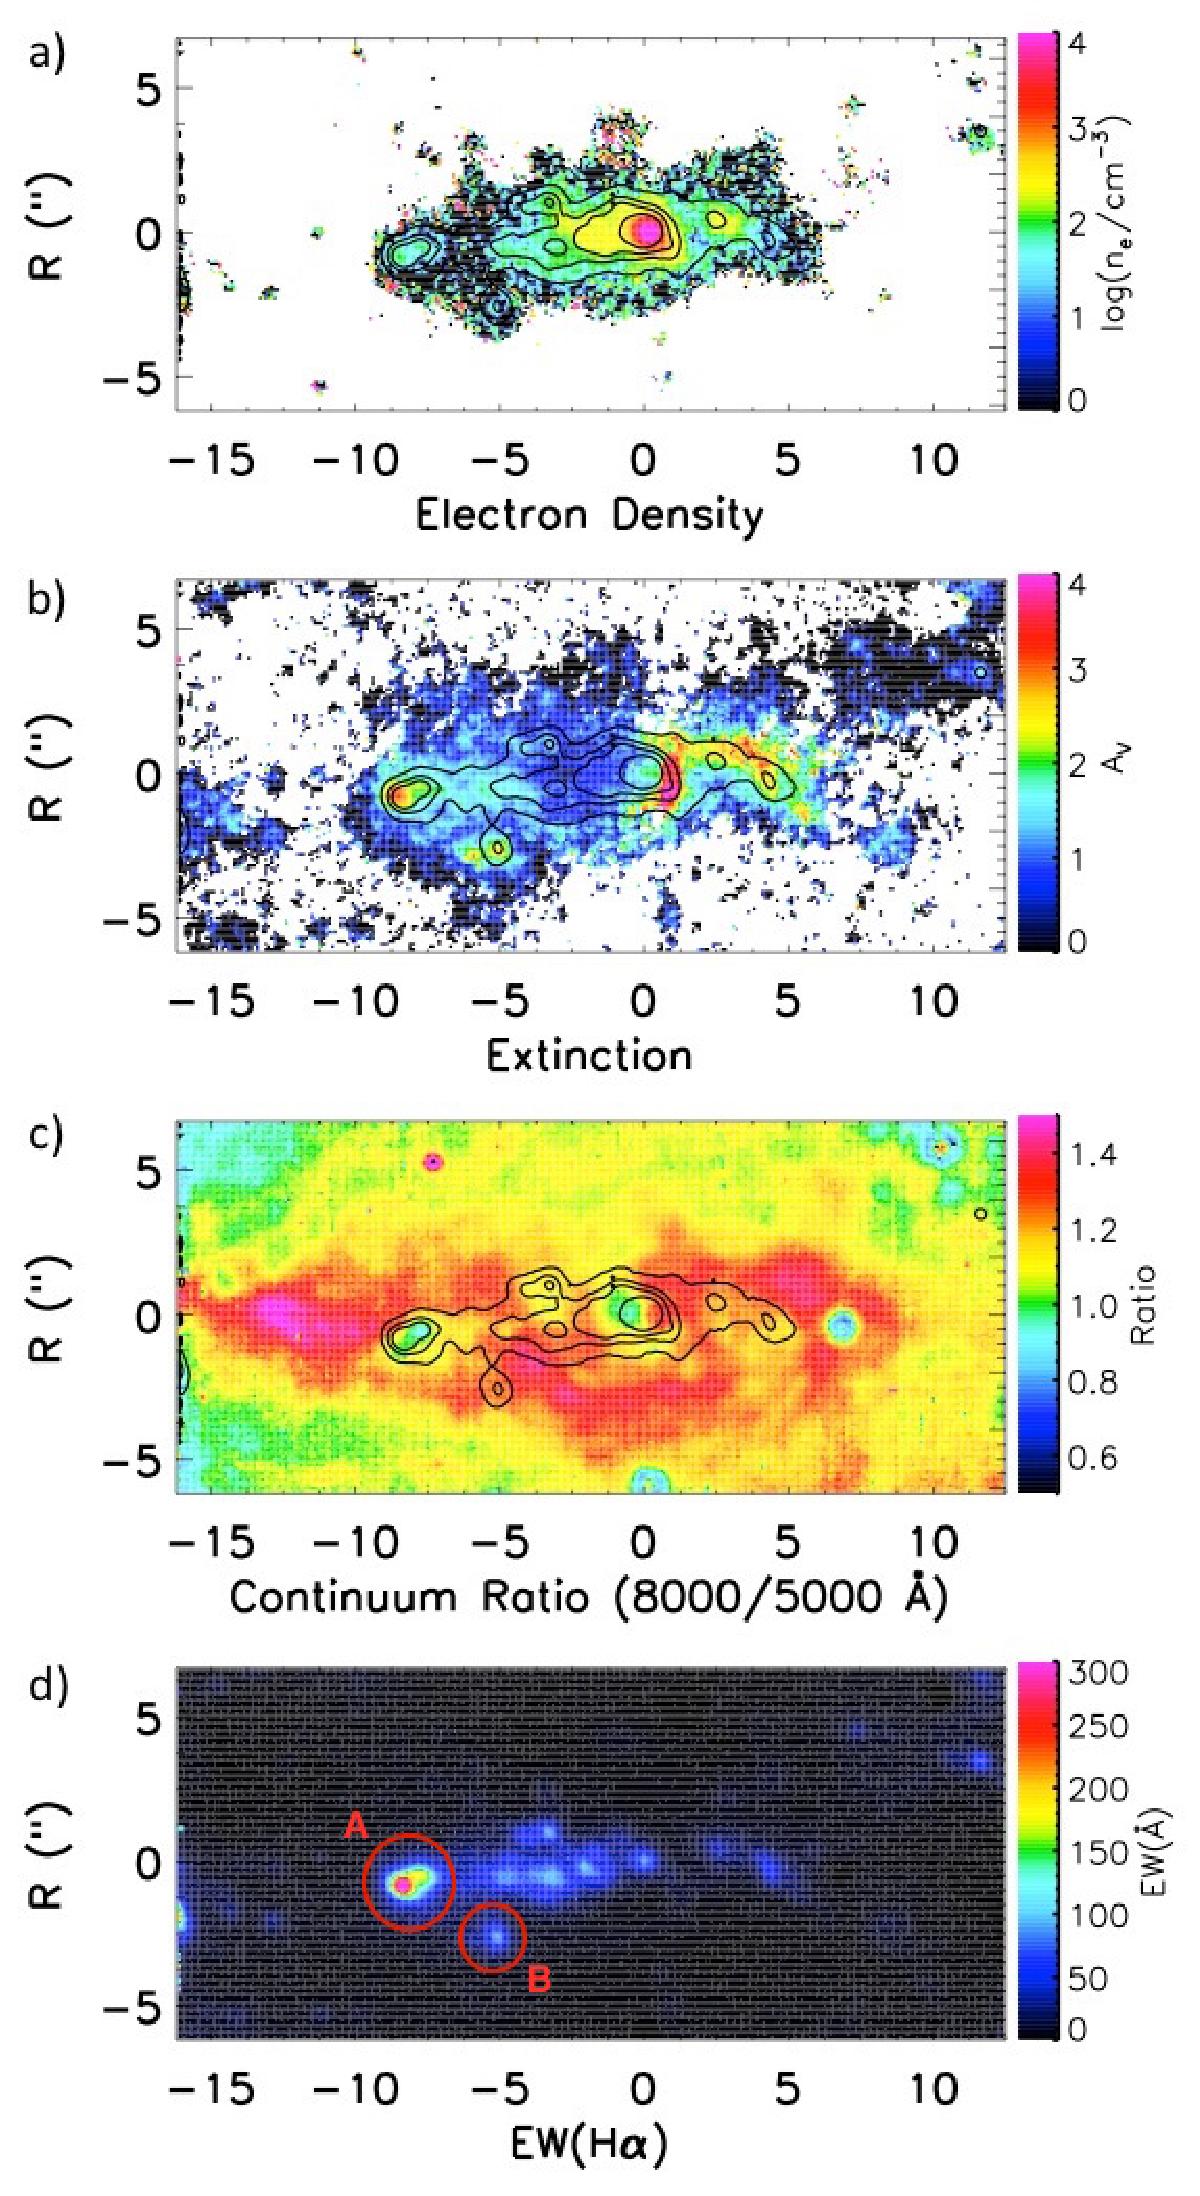
Electron density (panel a)) and extinction map (panel b)), as derived from the [SII]λ6716/[SII]λ6730 and Hα/Hβ line ratios (see text) with Hα contours overplotted. The star-forming clump has higher density and extinction than its surroundings. A dusty structure with very high extinction is detected just west of the nucleus and Hα peak, corresponding to the tip of the bar driven dust lane. Both maps show the spaxels with S/N> 5. The ratio between the continuum flux in the 8000–8500 Å spectral region and the 5100–5500 Å spectral region, with Hα contours overplotted, is shown in panel c). While the star-forming clumps and the nucleus are bluer due to the intrinsic shape of the continuum, the higher extinction regions show redder colors, tracing the dust distribution in the regions even where the S/N of the emission lines is lower. The dust lanes to the W and E of the nucleus, an extinction ridge to the S connecting the dust lane with the dust structure surrounding the nucleus are clearly visible. Panel d) shows the rest-frame Hα Equivalent Width map. The star-forming clump A, marked with a circle as well as clump B, shows the highest EW(Hα) = 350 Å in the field of view, suggesting an age of ~107 yrs (see text for details).
Current usage metrics show cumulative count of Article Views (full-text article views including HTML views, PDF and ePub downloads, according to the available data) and Abstracts Views on Vision4Press platform.
Data correspond to usage on the plateform after 2015. The current usage metrics is available 48-96 hours after online publication and is updated daily on week days.
Initial download of the metrics may take a while.


