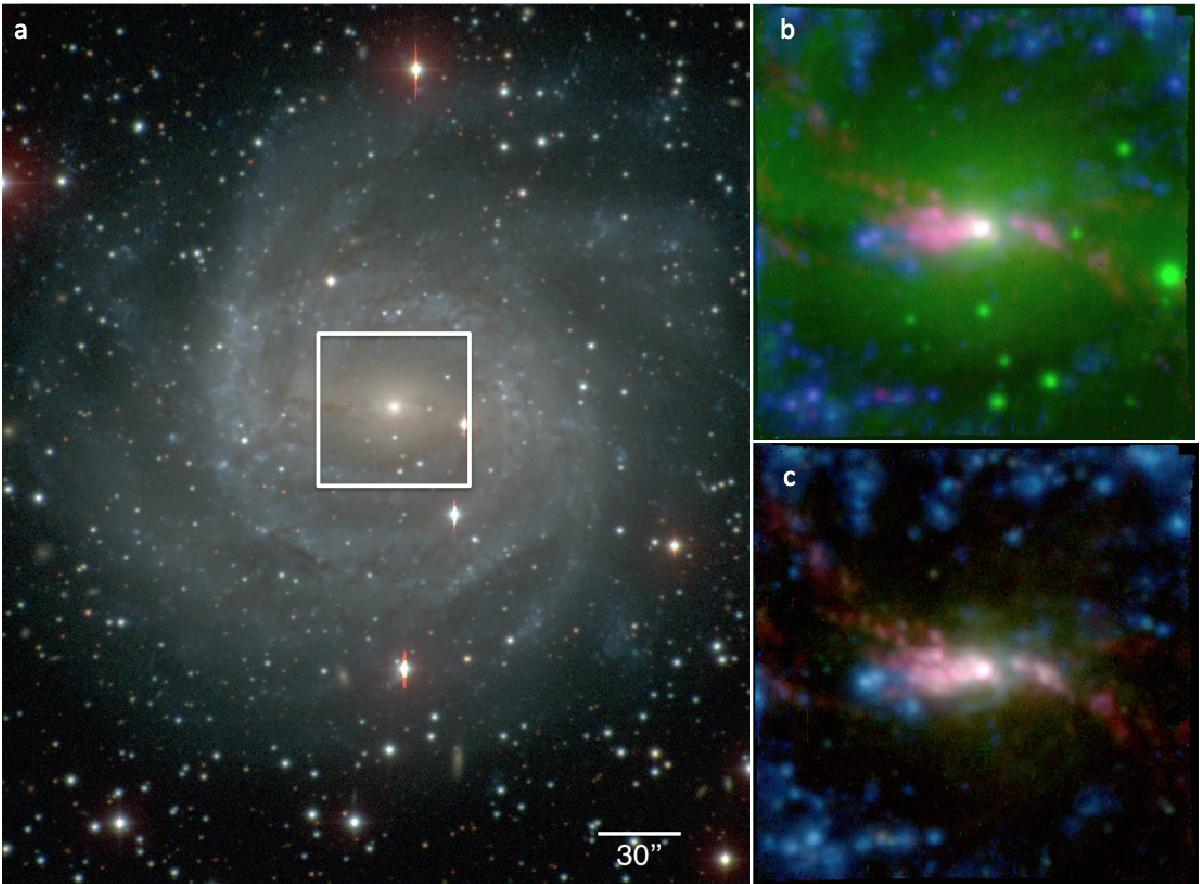
Fig. 1

Galaxy NGC 5643. Panel a) three-color (blue: B band; green: V band; red: I band) image of the galaxy obtained with the 2.5 m du Pont Telescope for the Carnegie-Irvine Galaxy Survey (CGS, Ho et al. 2011). The MUSE field of view is shown with a white square. North is up and east is left. Panel b) three colors MUSE map, showing Hα emission in blue, [OIII]λ5007 emission in red, and the integrated continuum emission from 5200 to 6000 Å in green. The tip of the dust lane in the bar, visible on larger scale in Panel a, is evident next to the blue clump east of the nucleus as a gap in the continuum emission. Panel c) three-color MUSE maps, showing Hα in blue and [OIII]λ5007 in red as before, and [NII]λ6584 emission in green. The two-sided AGN ionization cone traced by the filamentary [OIII] emission is prominent, as well as the strongly Hα emitting clumps between the two eastern lobes of the cone. North is up and east is left.
Current usage metrics show cumulative count of Article Views (full-text article views including HTML views, PDF and ePub downloads, according to the available data) and Abstracts Views on Vision4Press platform.
Data correspond to usage on the plateform after 2015. The current usage metrics is available 48-96 hours after online publication and is updated daily on week days.
Initial download of the metrics may take a while.


