Fig. 8
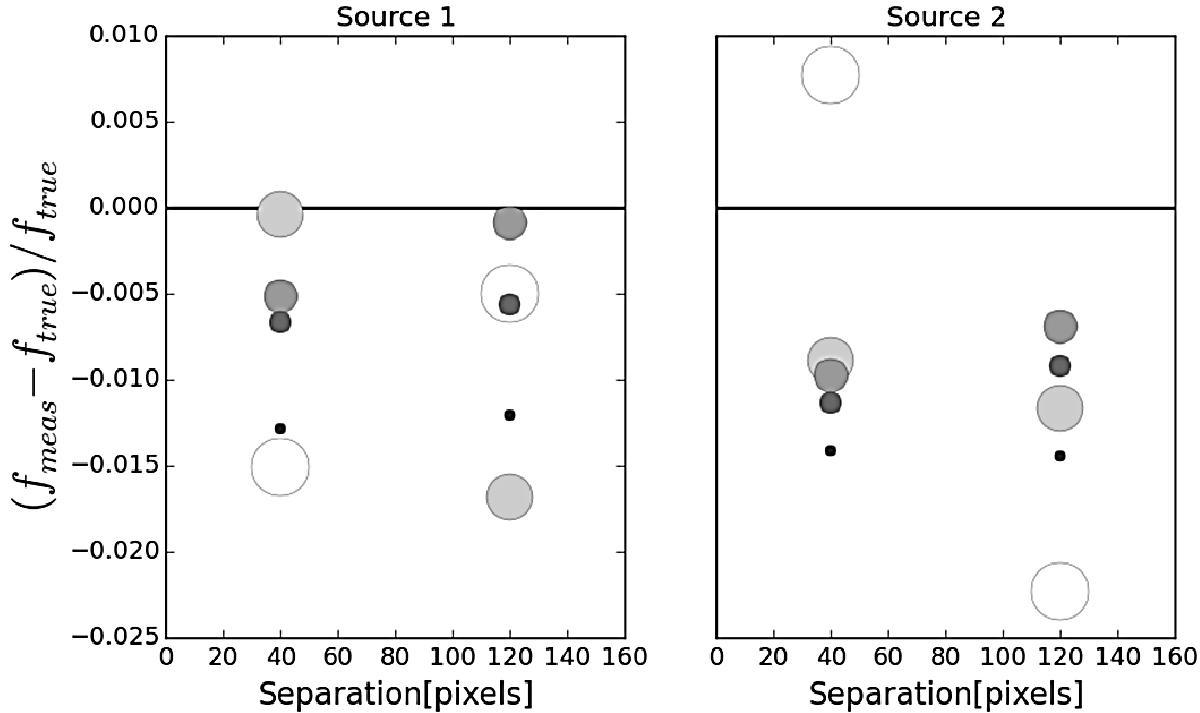
Effects of different segmentation areas on the measured flux of two isolated objects with identical flux and signal-to-noise ratio, at two possible separations of 40 and 120 pixels. Each panel shows the flux error in one of the objects at each separation distance. The shades and dimensions of the dots is a function of the radius of the segmentation, with darker and smaller dots corresponding to smaller segmentations. See text for more details.
Current usage metrics show cumulative count of Article Views (full-text article views including HTML views, PDF and ePub downloads, according to the available data) and Abstracts Views on Vision4Press platform.
Data correspond to usage on the plateform after 2015. The current usage metrics is available 48-96 hours after online publication and is updated daily on week days.
Initial download of the metrics may take a while.