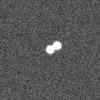
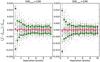
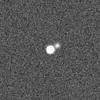
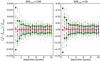
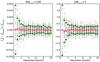
Fig. 7

Accuracy check on idealized PSF-shaped objects. 100 realizations of the same image containing two PSF-shaped objects at varying positions and signal-to-noise ratios have been produced and the fluxes have been measured with t-phot. In each row, the left image shows one of the 100 realizations with the largest considered separation (10 pixels). On the right, the first panel refers to the central object, and the second (on the right) to the shifted object; central signal-to-noise (S/Ncentr) ratios are, from top to bottom, 100, 100, 100 for the first source and 100, 10, 1 for the second source. In each panel, as a function of the separation interval between the two sources, the faint grey points show each of the 100 flux measurements (in relative difference with respect to the true input flux), the red diamonds are the averages of the 100 measurements, the red crosses show the nominal error given by the covariance matrix in t-phot, and the green dots the standard deviation of the 100 measurements. See text for more details.
Current usage metrics show cumulative count of Article Views (full-text article views including HTML views, PDF and ePub downloads, according to the available data) and Abstracts Views on Vision4Press platform.
Data correspond to usage on the plateform after 2015. The current usage metrics is available 48-96 hours after online publication and is updated daily on week days.
Initial download of the metrics may take a while.