Fig. 18
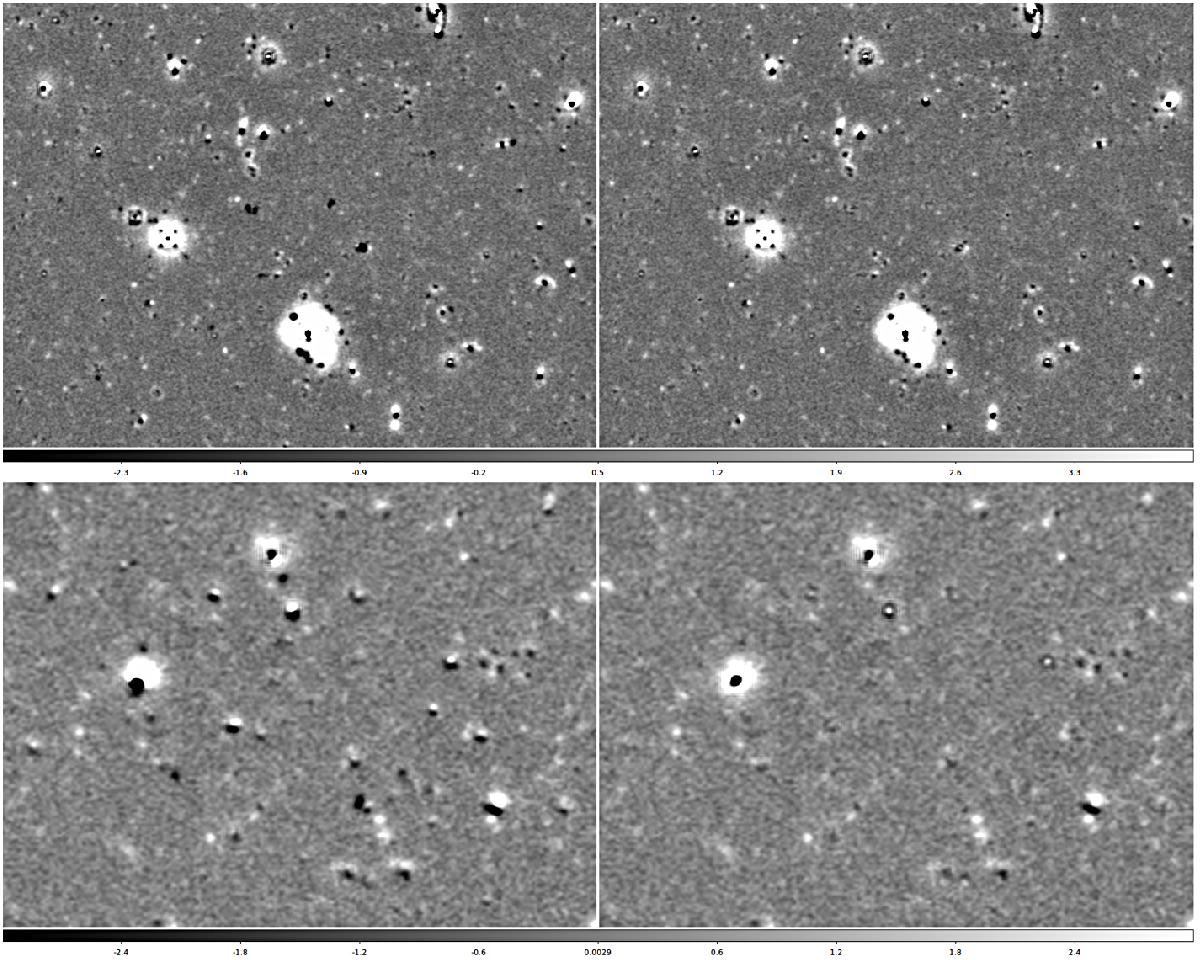
UDS I-band tfit versus t-phot comparison. The panels on the left show two small patches of the official CANDELS residual image obtained using t-fit. The residual images of the same regions are showed in the right panels, this time obtained using t-phot with cells-on-objects method and improved local kernel registration. We note the disappearence of many spurious black spots.
Current usage metrics show cumulative count of Article Views (full-text article views including HTML views, PDF and ePub downloads, according to the available data) and Abstracts Views on Vision4Press platform.
Data correspond to usage on the plateform after 2015. The current usage metrics is available 48-96 hours after online publication and is updated daily on week days.
Initial download of the metrics may take a while.