Fig. 14
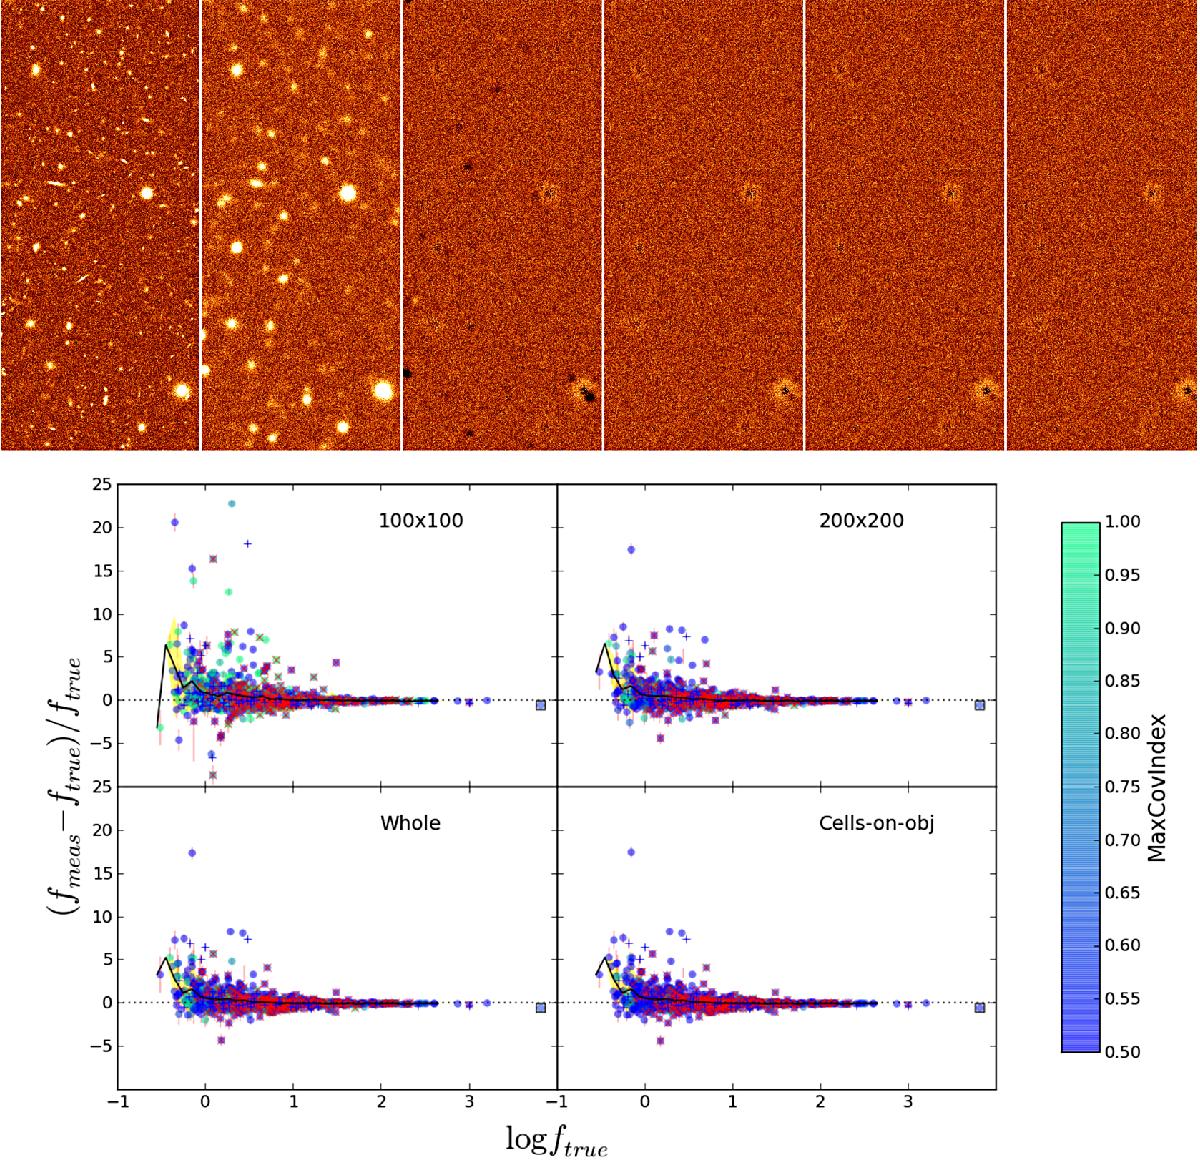
Accuracy of the flux determination. For the same simulation described in Fig. 11, the plots show the results for four different fitting methods. Top panel, left to right: HRI (FWHM = 0.2′′), LRI (FWHM = 1.66′′), residuals using a regular grid of 100 × 100 pixels cells (standard tfit approach), a regular grid of 200 × 200 pixels cells, a single fit on the whole image, and the cells-on-objects method. The spurious fluctuations in the last two panels are due to segmentation inaccuracies, as in Fig. 11. Bottom panels, left to right and top to bottom: relative measured flux differences with respect to true fluxes, same order as above. The values of the covariance index are different in each case because of the varying sizes of the cells (and therefore of the relative matrix).
Current usage metrics show cumulative count of Article Views (full-text article views including HTML views, PDF and ePub downloads, according to the available data) and Abstracts Views on Vision4Press platform.
Data correspond to usage on the plateform after 2015. The current usage metrics is available 48-96 hours after online publication and is updated daily on week days.
Initial download of the metrics may take a while.