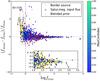
Fig. 11

Accuracy of the flux determination in a simulation containing extended objects, overlapping priors, and SExtractor detection. Top: relative flux difference (fmeas − ftrue) /ftrue versus logarithm of the input flux ftrue for a simulated image populated with extended sources (FWHM = 1.66′′). Symbols and colours are as in Fig. 9. The inner panel shows a magnification of the brighter end of the distribution. The outlier marked with the open black circle, ID = 720, is shown in the bottom panel: left to right, HRI (FWHM = 0.2′′), LRI, SExtractor segmentation map and “true” segmentation map. The green circles show the object detected via SExtractor, while the blue cross shows its “true” position. See text for more details.
Current usage metrics show cumulative count of Article Views (full-text article views including HTML views, PDF and ePub downloads, according to the available data) and Abstracts Views on Vision4Press platform.
Data correspond to usage on the plateform after 2015. The current usage metrics is available 48-96 hours after online publication and is updated daily on week days.
Initial download of the metrics may take a while.