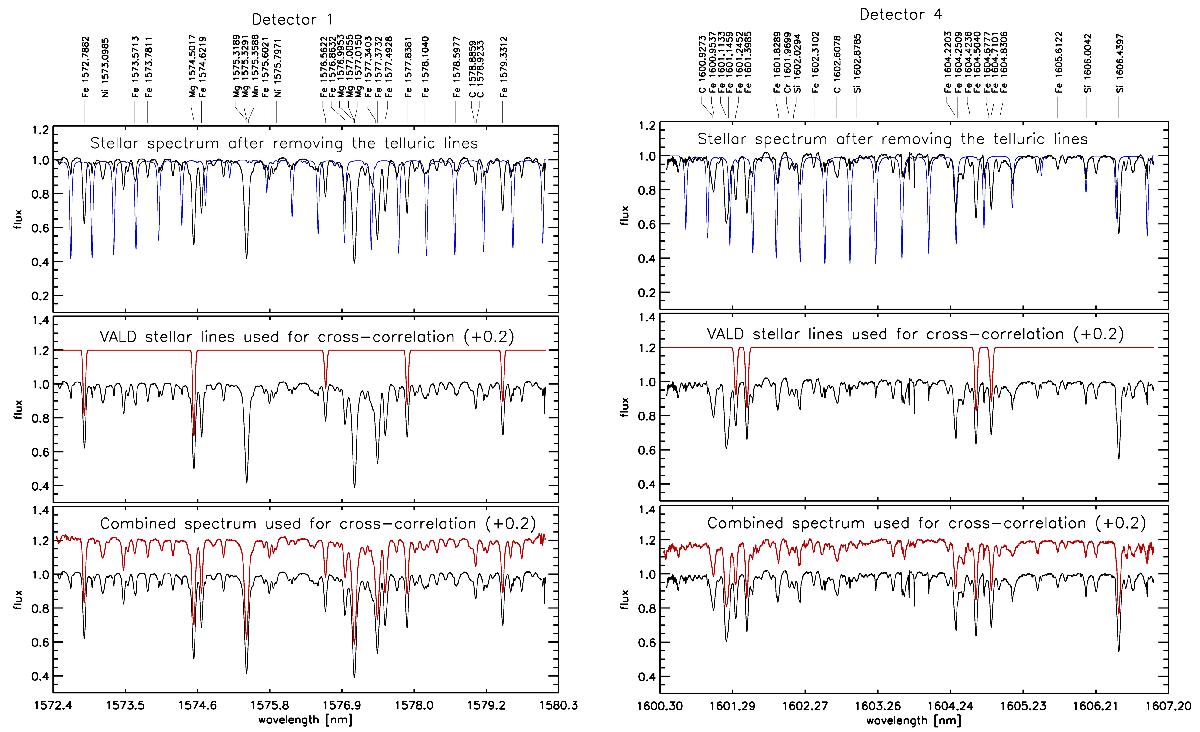
Fig. 2

Top: spectra for detector one (left) and four (right) are divided by the synthetic telluric spectra (blue), removing the atmospheric contribution, and thus only leaving the stellar lines (black). Many of these spectra were automatically identified in the VALD line catalog. Middle: only the nonblended lines with well-defined profiles are used for obtaining the RVs via cross-correlation with a synthetic stellar template modeled from the VALD line catalog. Bottom: the telluric-free spectra from all observational epochs are later shifted and median-combined in one very high S/N stellar template, which is then used for cross-correlation.
Current usage metrics show cumulative count of Article Views (full-text article views including HTML views, PDF and ePub downloads, according to the available data) and Abstracts Views on Vision4Press platform.
Data correspond to usage on the plateform after 2015. The current usage metrics is available 48-96 hours after online publication and is updated daily on week days.
Initial download of the metrics may take a while.


