Fig. 7
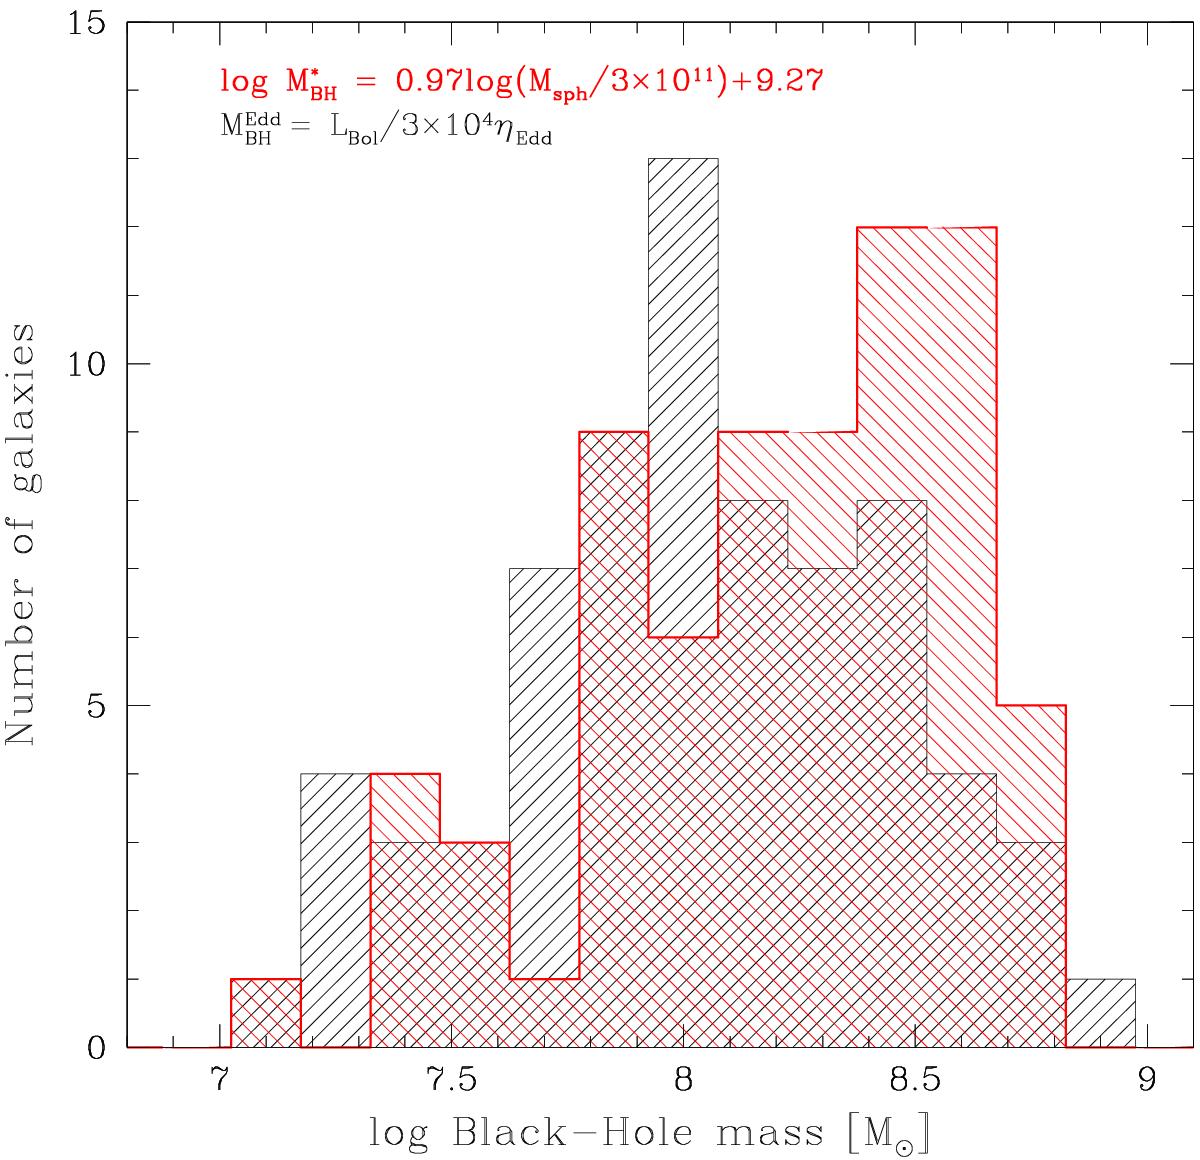
Left: black-hole masses calculated with two different methods shown in the lagend. The histogram in black (left) was calculated using the Eddington ratios and the bolometric luminosities. The histogram in red (right) shows the distribution of masses calculated using the relation between MBH and Msph. Right: correlation between ![]() and
and ![]() . The solid line shows a least-squares fit with coefficients indicated in the legend.
. The solid line shows a least-squares fit with coefficients indicated in the legend.
Current usage metrics show cumulative count of Article Views (full-text article views including HTML views, PDF and ePub downloads, according to the available data) and Abstracts Views on Vision4Press platform.
Data correspond to usage on the plateform after 2015. The current usage metrics is available 48-96 hours after online publication and is updated daily on week days.
Initial download of the metrics may take a while.