Fig. 3
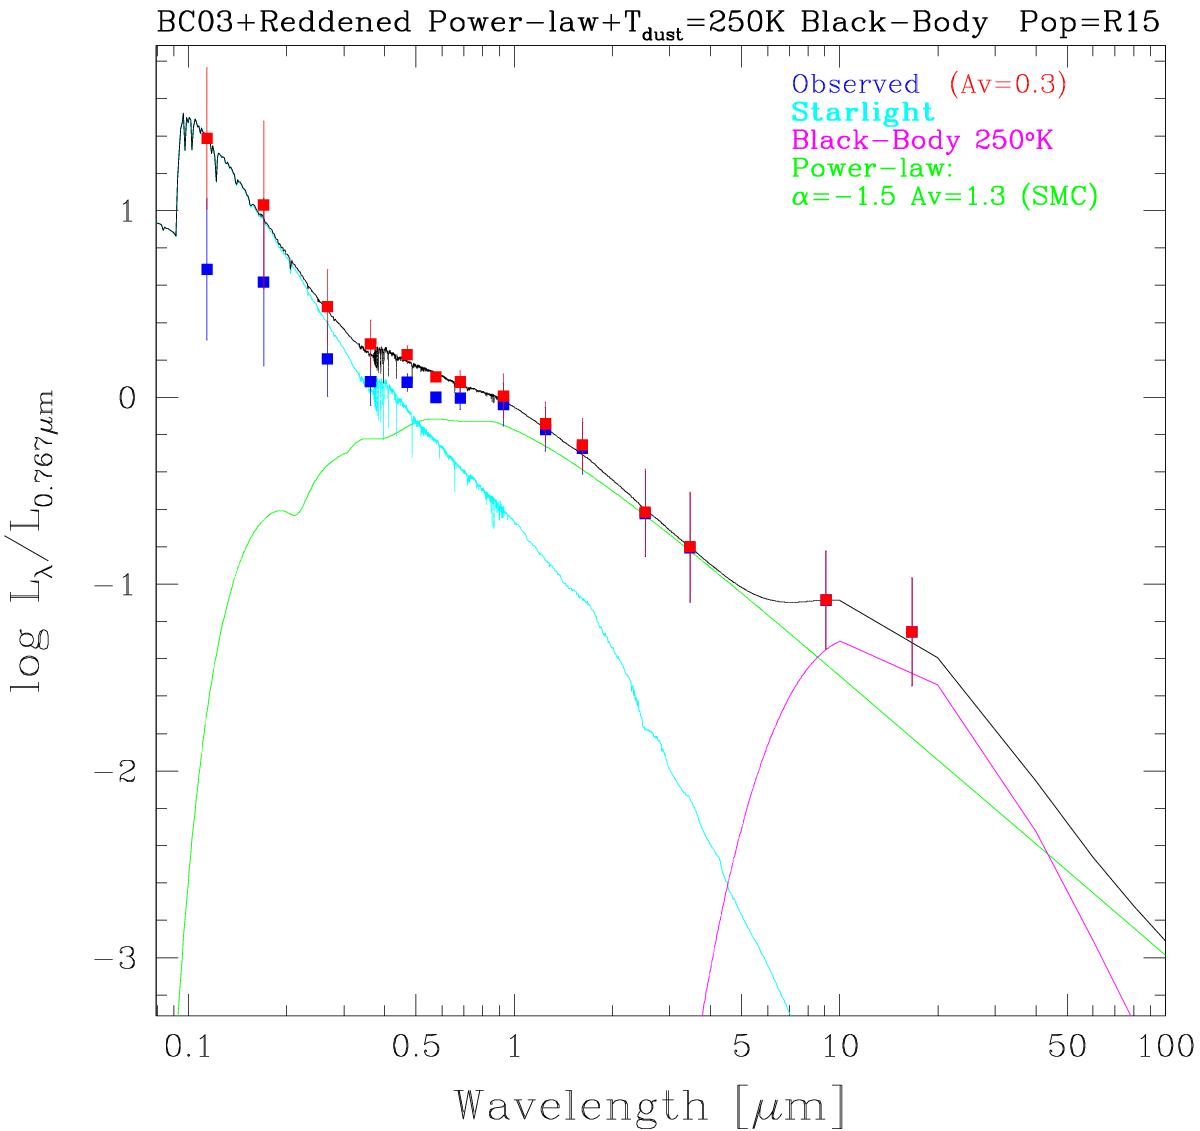
Best fit model SED for the average of the 72 K+A galaxies in our sample compared to the average observed broad-band fluxes corrected for extinction as described in the text and normalised to the SDSS i′-band (F0.767 μm). The blue symbols show the observed photometric data points and the red symbols show the observations corrected for extinction using the average visual extinction shown in parenthesis in the figure legend and the GD1 extinction law. The three components of the fit are colour-coded as follows: cyan shows the contribution of the stars computed from the Starlight population-synthesis fits to the SDSS spectra; green shows the obscured power-law; and the magenta represents the Tdust = 250 K hot dust component, which is required by the mid-IR data. The sum of these three components is shown in black. The error bars are not observational errors but correspond to the 1σ dispersions of the normalised fluxes for all the objects included in each band, the number of which varies from 45 in the FUV band to 72 for the SDSS bands. The reddened power-law component is the one included in the population synthesis models, thus the label Pop = R15 in the figure legend.
Current usage metrics show cumulative count of Article Views (full-text article views including HTML views, PDF and ePub downloads, according to the available data) and Abstracts Views on Vision4Press platform.
Data correspond to usage on the plateform after 2015. The current usage metrics is available 48-96 hours after online publication and is updated daily on week days.
Initial download of the metrics may take a while.