Fig. 2
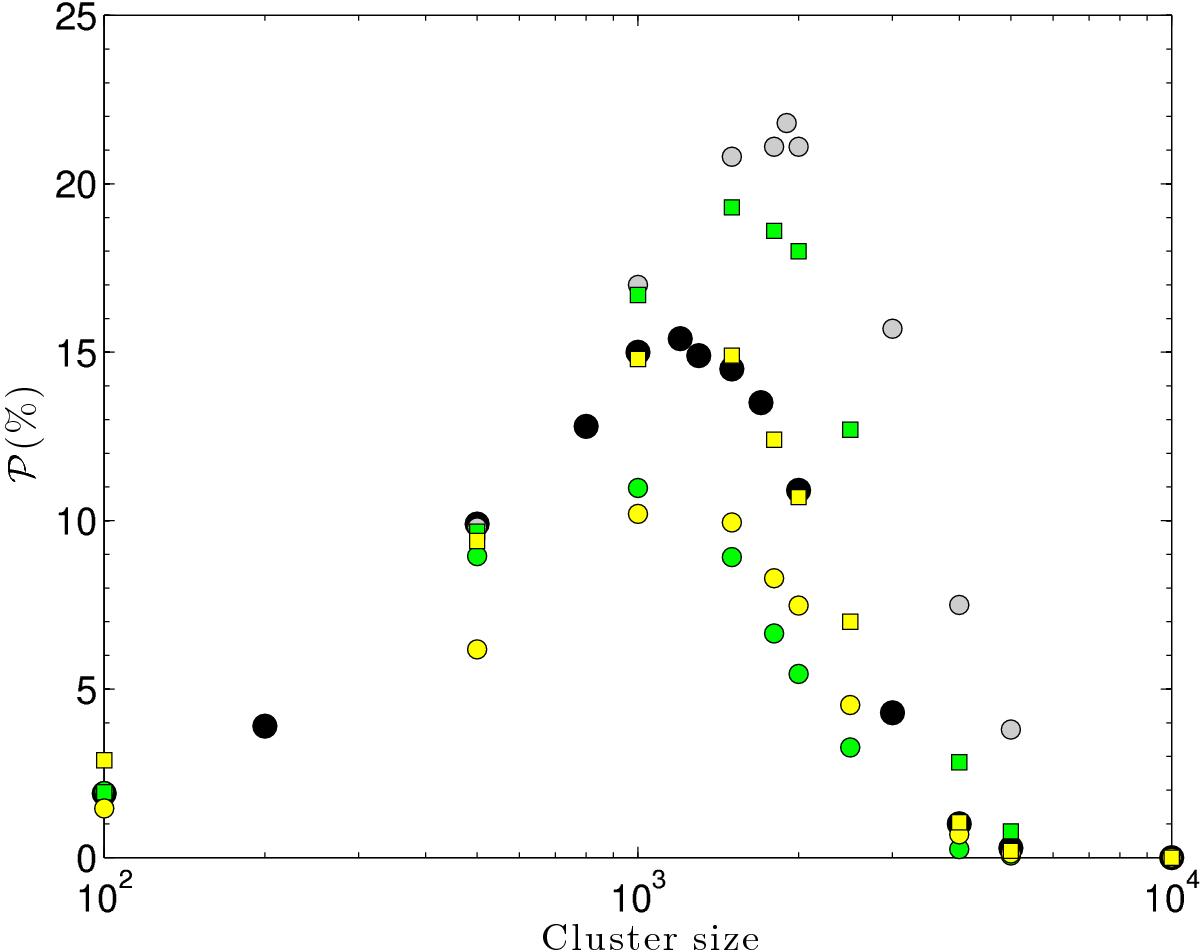
Probability ![]() (in %), as a function of the cluster size N, to realize the double condition: 1) the number of stars with mass higher than MSN is less than nSB; and 2) one star at least has a mass greater than Mmin, where the values nSB, Mmin, and MSN are set to vary. For each point, the IMF (see text) was simulated 10 000 times. Filled circles: nSB = 5, Mmin = 32 M⊙, and MSN = 8 M⊙. Grey circles: all are the same, but MSN = 10 M⊙. Green circles: all the same, but nSB = 4. Green squares: all the same, but nSB = 6. Yellow circles: all the same, but Mmin = 40 M⊙. Yellow squares: all the same, but Mmin = 25 M⊙. This figure, essentially identical to Fig. 8 of Gounelle & Meynet (2012), is shown for clarity.
(in %), as a function of the cluster size N, to realize the double condition: 1) the number of stars with mass higher than MSN is less than nSB; and 2) one star at least has a mass greater than Mmin, where the values nSB, Mmin, and MSN are set to vary. For each point, the IMF (see text) was simulated 10 000 times. Filled circles: nSB = 5, Mmin = 32 M⊙, and MSN = 8 M⊙. Grey circles: all are the same, but MSN = 10 M⊙. Green circles: all the same, but nSB = 4. Green squares: all the same, but nSB = 6. Yellow circles: all the same, but Mmin = 40 M⊙. Yellow squares: all the same, but Mmin = 25 M⊙. This figure, essentially identical to Fig. 8 of Gounelle & Meynet (2012), is shown for clarity.
Current usage metrics show cumulative count of Article Views (full-text article views including HTML views, PDF and ePub downloads, according to the available data) and Abstracts Views on Vision4Press platform.
Data correspond to usage on the plateform after 2015. The current usage metrics is available 48-96 hours after online publication and is updated daily on week days.
Initial download of the metrics may take a while.