Fig. 9
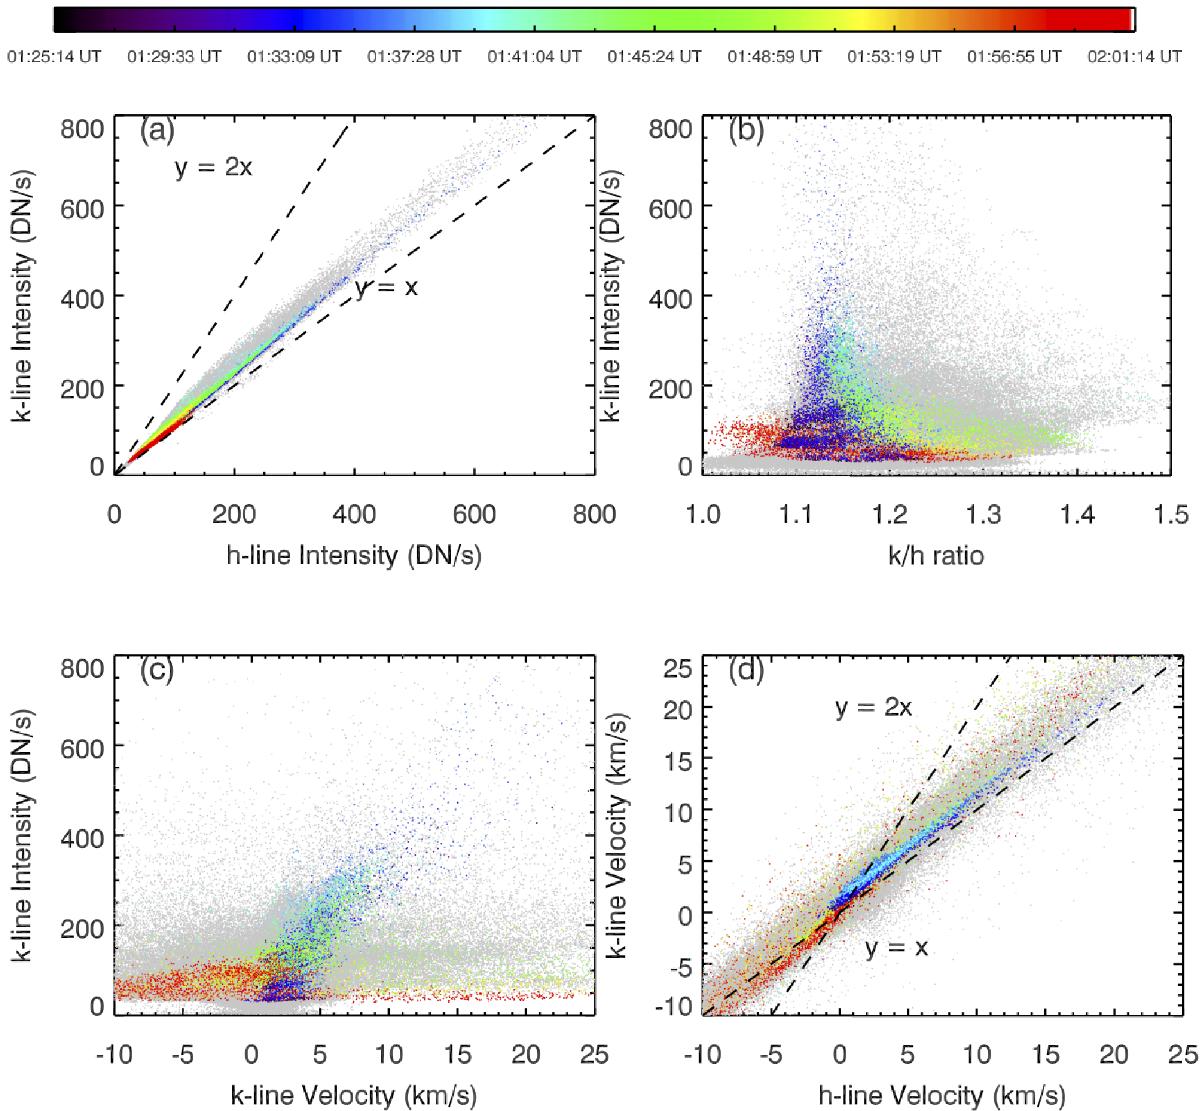
Scatter plots showing correlations of several spectral properties over time. Coloured pixels are pixels within the flaring region, where color refers to time. The background are pixels from the full field of view. a) The correlation between the h and k line intensities with lines Rkh = 1, and Rkh = 2 shown. b) The scatter plot of Rkh with k-line intensity. c) The scatter plot of the k-line intensity and k-line centroid velocity. d) The correlation between the k-line and h-line centroid velocities
Current usage metrics show cumulative count of Article Views (full-text article views including HTML views, PDF and ePub downloads, according to the available data) and Abstracts Views on Vision4Press platform.
Data correspond to usage on the plateform after 2015. The current usage metrics is available 48-96 hours after online publication and is updated daily on week days.
Initial download of the metrics may take a while.