Fig. 2
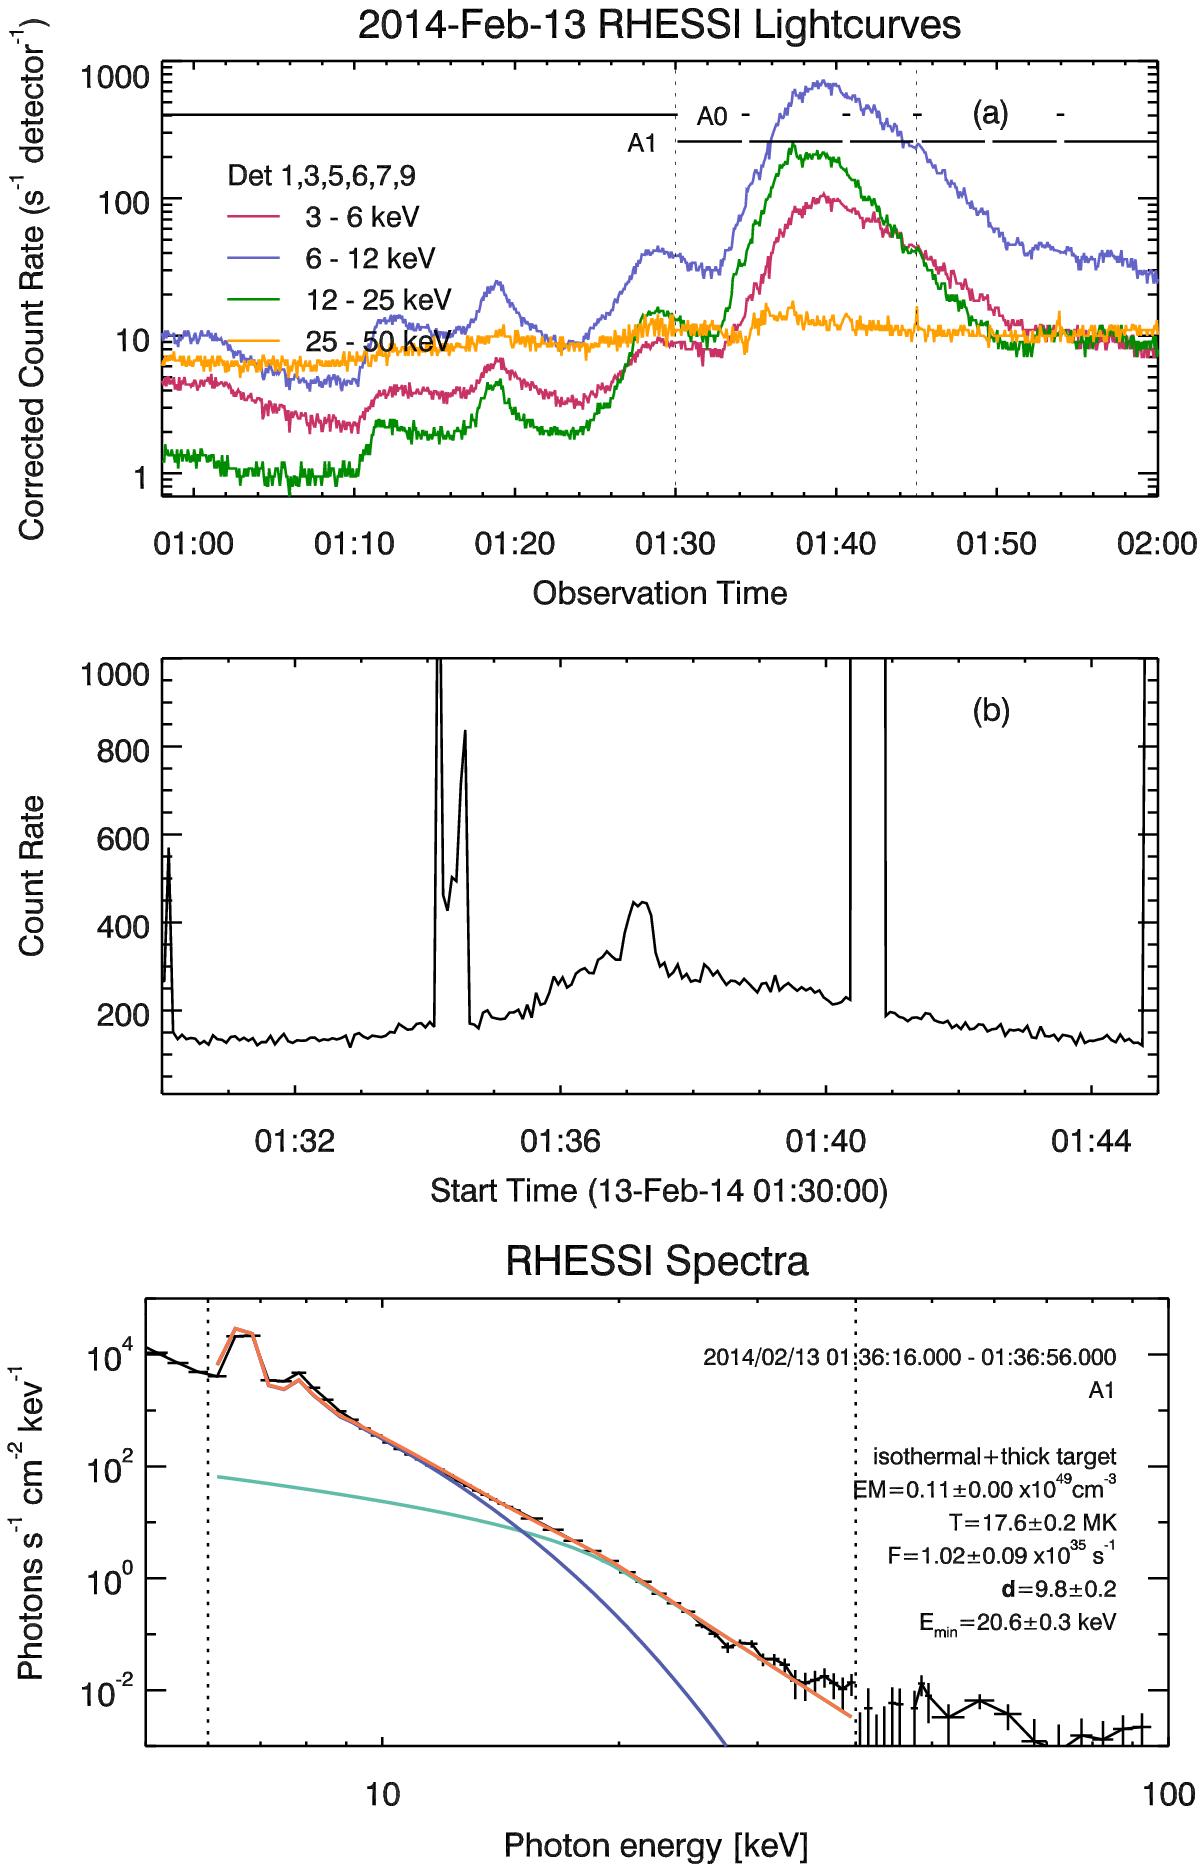
a) RHESSI count rates (corrected for the attenuator changes, shown), for the 2014-Feb-13 M1.8 flare, also showing several pre-flare peaks. Dotted lines indicate the zoomed-in portion in the lower panel. b) The 20–50 keV count rate averaged over the detectors (note this has not been corrected for attenuator changes), illustrating the small non-thermal peak present at ~01:35:30–01:38:00 UT. c) RHESSI hard X-ray spectrum at 01:36:16 UT, fitted with an isothermal (green) plus thick-target (blue) model. Horizontal bars show the energy binning and vertical bars the uncertainty of the data. The vertical dashed lines indicate the range of the data used in the model fitting.
Current usage metrics show cumulative count of Article Views (full-text article views including HTML views, PDF and ePub downloads, according to the available data) and Abstracts Views on Vision4Press platform.
Data correspond to usage on the plateform after 2015. The current usage metrics is available 48-96 hours after online publication and is updated daily on week days.
Initial download of the metrics may take a while.