Free Access
Fig. 14
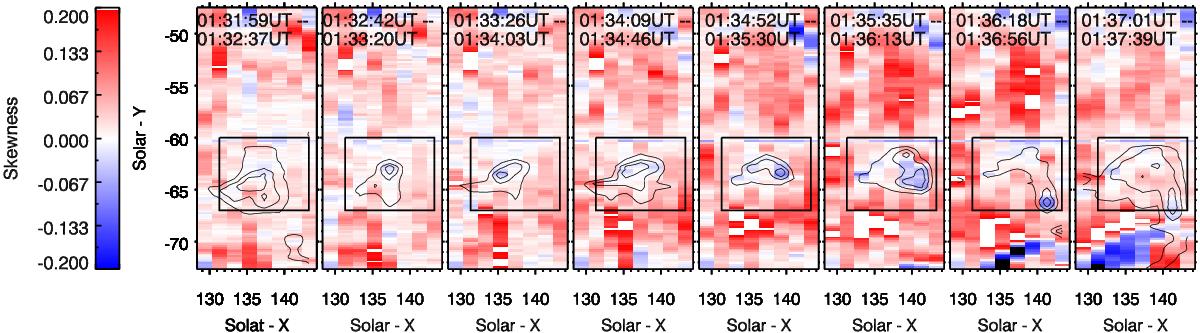
The asymmetry in the k-line (h-line similar). The box shows the location of the NR, where a blue asymmetry can be seen in several pixels between ~01:34 UT–~01:37 UT. The 40%, 60% and 80% intensity contours in each panel are shown for comparison.
Current usage metrics show cumulative count of Article Views (full-text article views including HTML views, PDF and ePub downloads, according to the available data) and Abstracts Views on Vision4Press platform.
Data correspond to usage on the plateform after 2015. The current usage metrics is available 48-96 hours after online publication and is updated daily on week days.
Initial download of the metrics may take a while.