Free Access
Fig. 12
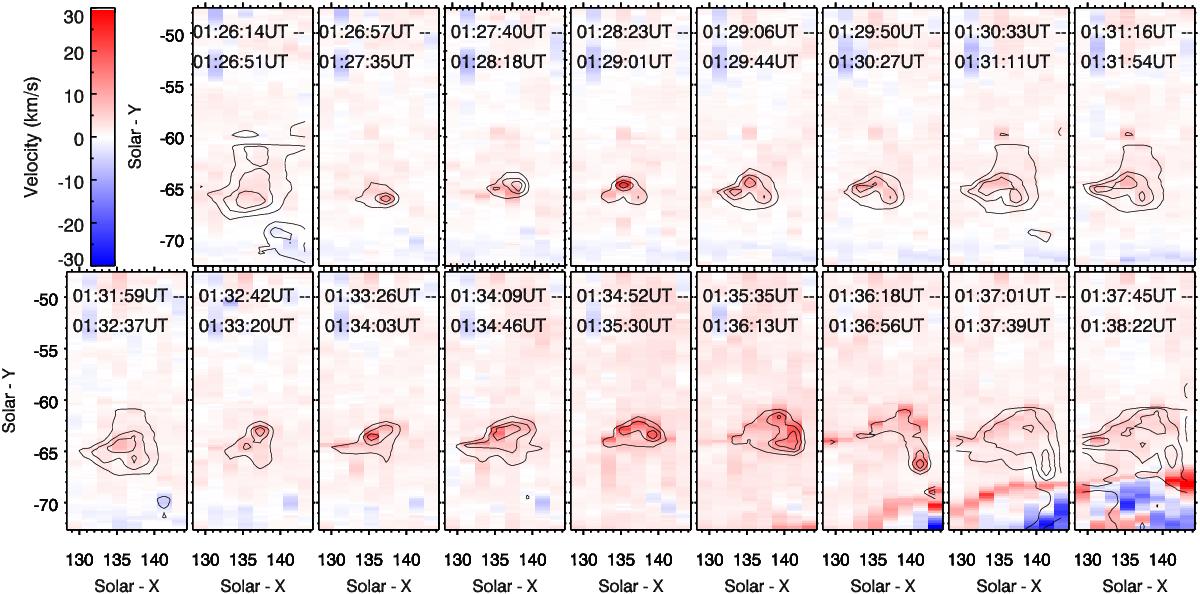
The velocity of the h line over time, showing the shift of line centroid. The redshifts occur at locations of highest intensity enhancement and track the outer edge of the ribbon. The 40%, 60% and 80% intensity contours in each panel are shown for comparison.
Current usage metrics show cumulative count of Article Views (full-text article views including HTML views, PDF and ePub downloads, according to the available data) and Abstracts Views on Vision4Press platform.
Data correspond to usage on the plateform after 2015. The current usage metrics is available 48-96 hours after online publication and is updated daily on week days.
Initial download of the metrics may take a while.