Free Access
Fig. 11
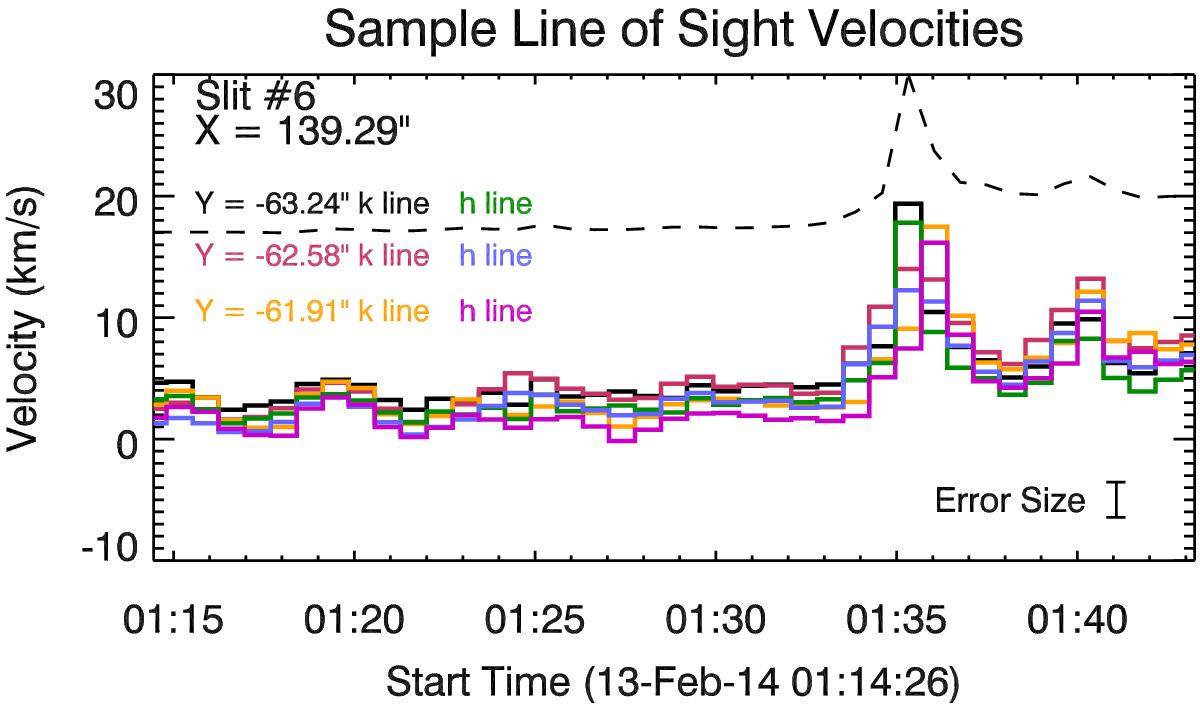
Example line of sight velocities, showing both the h and k line velocities. The dotted line is a scaled sample lightcurve, illustrating that velocity increases are associated with intensity enhancements.
Current usage metrics show cumulative count of Article Views (full-text article views including HTML views, PDF and ePub downloads, according to the available data) and Abstracts Views on Vision4Press platform.
Data correspond to usage on the plateform after 2015. The current usage metrics is available 48-96 hours after online publication and is updated daily on week days.
Initial download of the metrics may take a while.